

Question: Define success for your qualitative data to be the category with the largest relative frequency from your Lab 2 Part 1A table. ______________________ Lab 2
Define "success" for your qualitative data to be the category with the largest relative frequency from your Lab 2 Part 1A table. ______________________
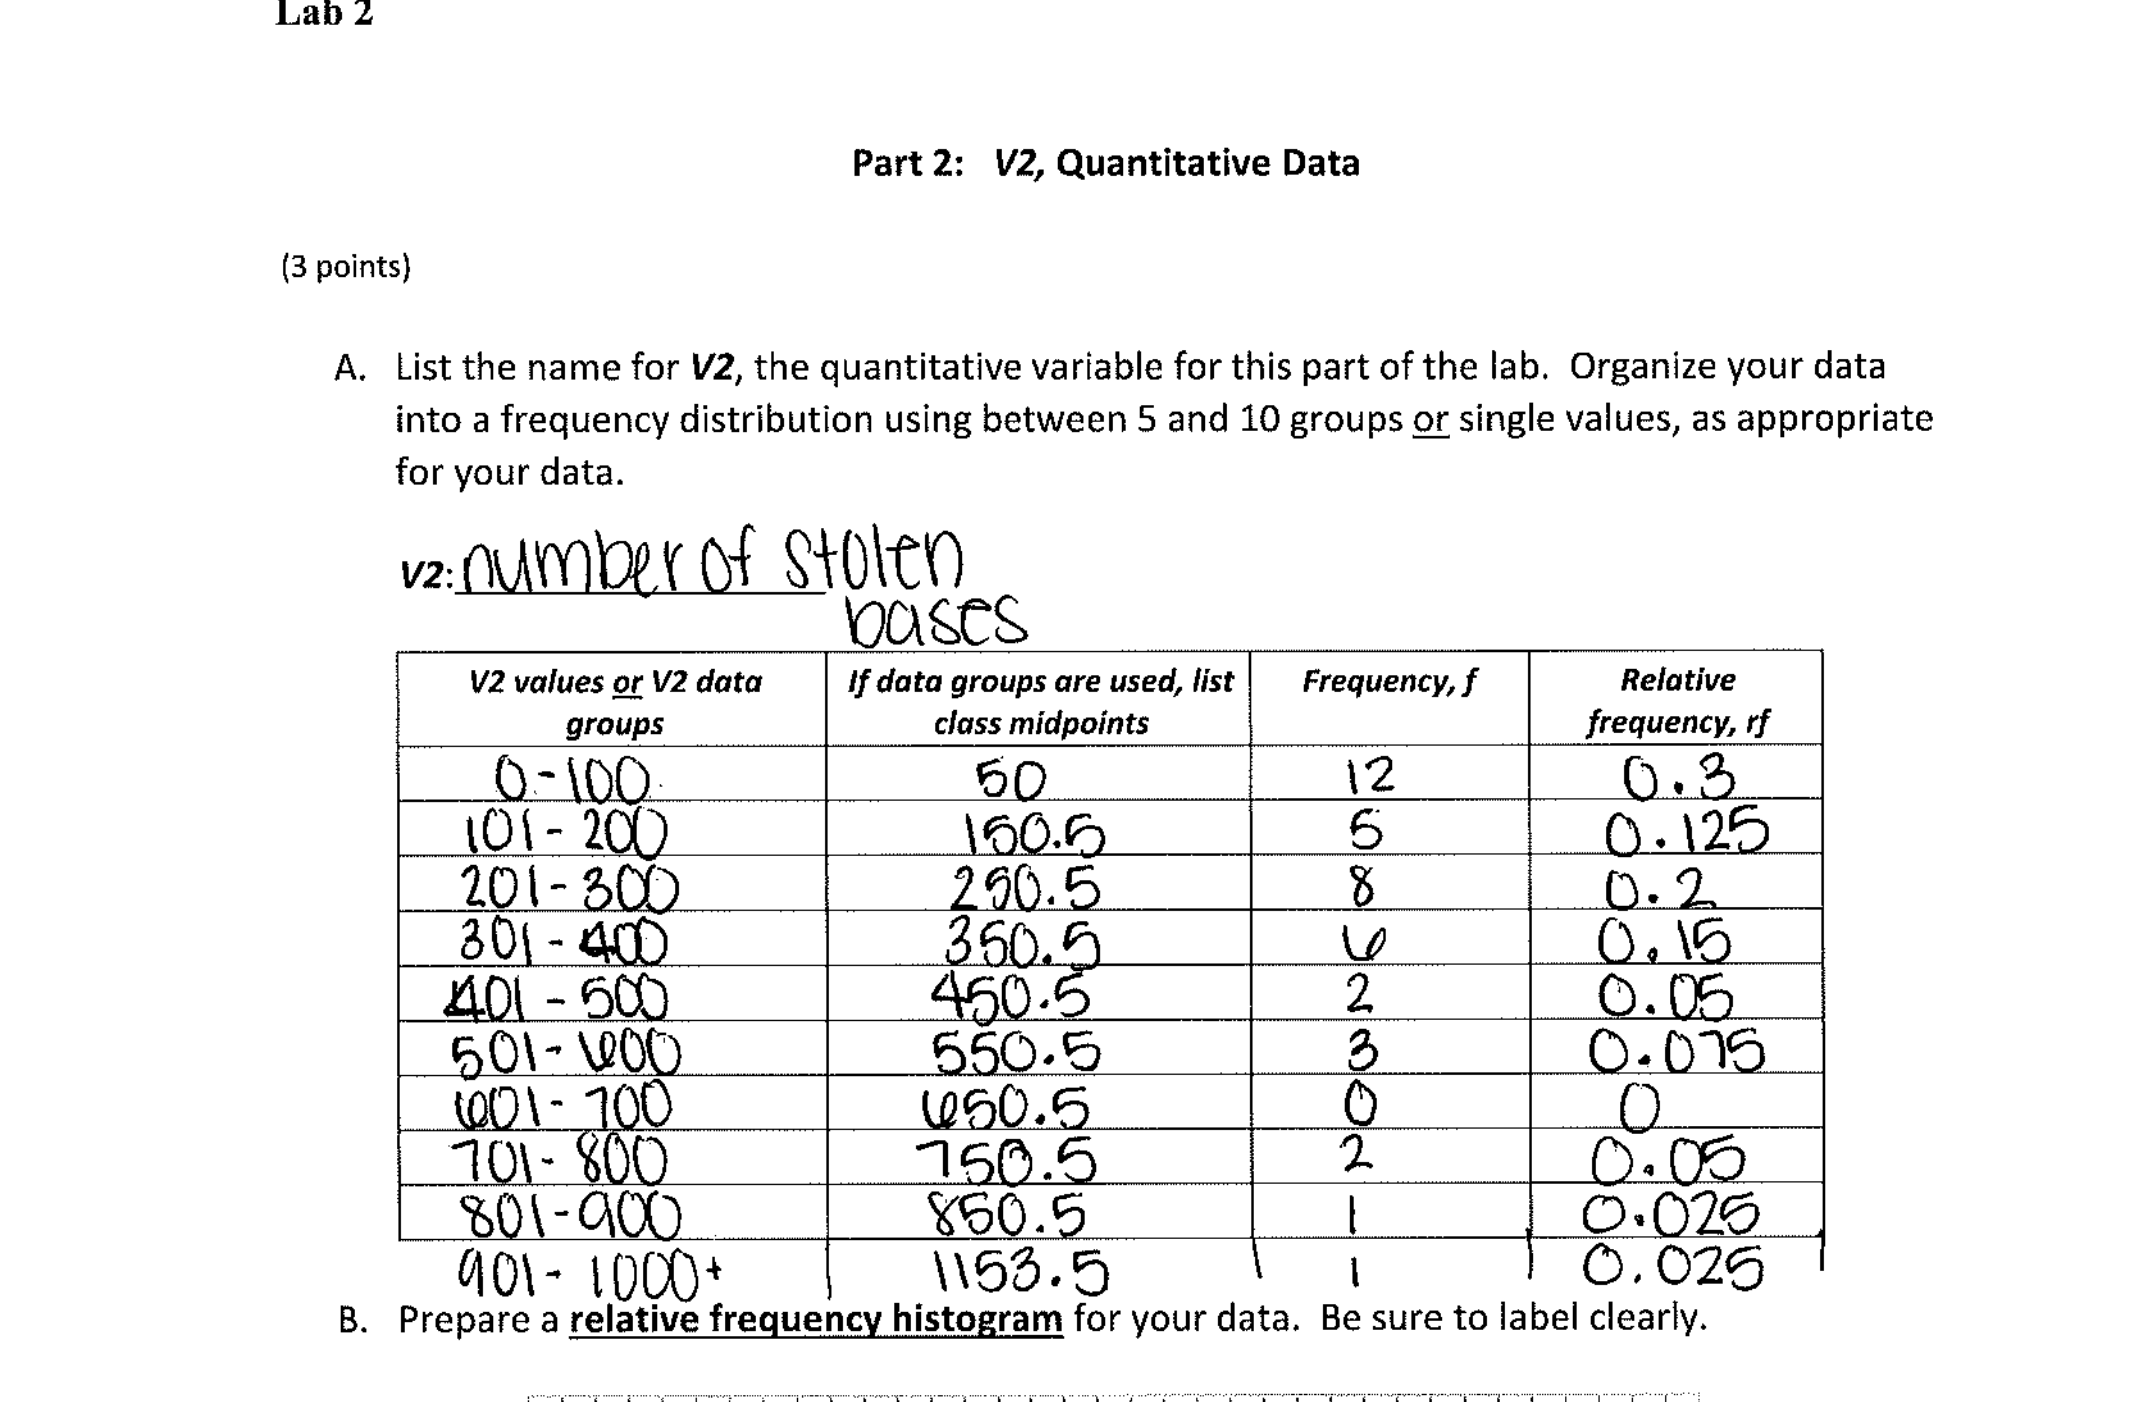
Lab 2 Part 2: V2, Quantitative Data (3 points) A. List the name for V2, the quantitative variable for this part of the lab. Organize your data into a frequency distribution using between 5 and 10 groups or single values, as appropriate for your data. v2 : number of stolen bases V2 values or V2 data If data groups are used, list Frequency, f Relative groups class midpoints frequency, rf 0- 100 50 12 0 . 3 101- 200 160.5 0 . 125 201-300 250.5 8 0. 2 301 - 400 350.5 0 . 15 401 - 500 450.5 2 0. 05 501-100 550.5 3 0 . 075 101 - 700 (050.5 701- 800 750.5 2 0. 05 801 -900 850.5 0. 025 901- 100 0+ 1153.5 - 0. 026 B. Prepare a relative frequency histogram for your data. Be sure to label clearly
Step by Step Solution
There are 3 Steps involved in it

Get step-by-step solutions from verified subject matter experts