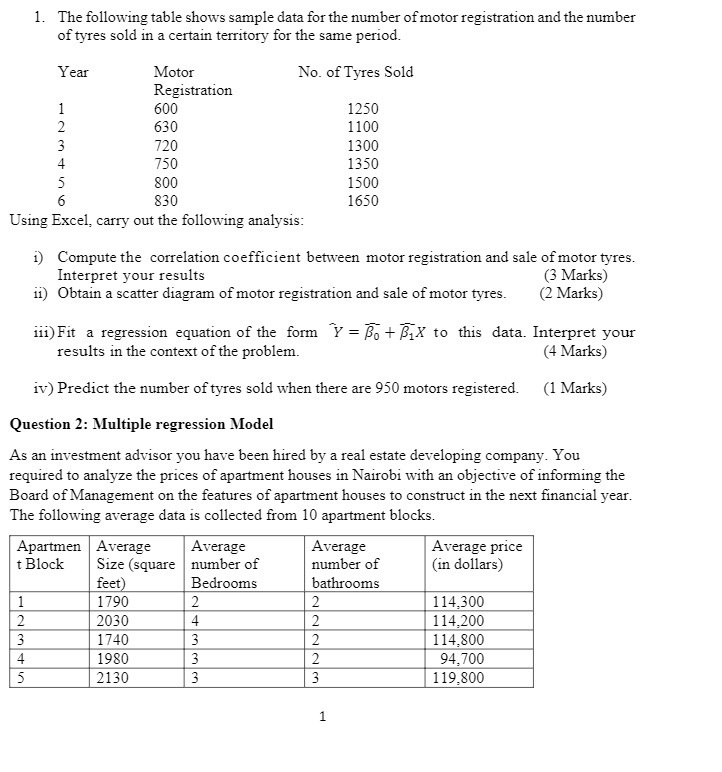
Question: 1. rI'he following table shows sample data for the number of motor registration and the number of tyres sold in a certain territory for the

1. rI'he following table shows sample data
1. rI'he following table shows sample data for the number of motor registration and the number of tyres sold in a certain territory for the same period. Year Motor No. of Tyres Sold Registration 1 6130 12513 2 631:] 1 11313 3 TED 131313 4 T513 1351:! 5 800 l 513D 6 831:} 16513 Using Excel, carry out the following analysis: i) Compute the correlation coefficient between motor registration and sale of motor tyres. Interpret your results (3 hiarlcs} ii} Obtain a scatter diagram of motor registration and sale of motor tyres. (2 Marks) iii) Fit a regression equation of the form AF = Ii; + EX to this data. Interpret your results in the context of the problem. (4 Marks} iv} Predict the number of tyres sold when there are 951} motors registered. (1 Marks) Question 2: Multiple regression Elude! As an investment advisor you have been hired by a real estate developing company. You required to analyze the prices of apartment houses in Nairobi with an objective of informmg the Board of Management on the features of apartment houses to construct in the next nancial year. The following average data is collected from If) apartment blocks. Apaitnien Average Average Average Average price t Block Size {square number of number of (in dollars) feet Bedrooms bathrooms _ NEH] 114.333

Step by Step Solution

There are 3 Steps involved in it

1 Expert Approved Answer
Step: 1 Unlock blur-text-image
Question Has Been Solved by an Expert!

Get step-by-step solutions from verified subject matter experts

Step: 2 Unlock
Step: 3 Unlock

Students Have Also Explored These Related Finance Questions!