

Question: 1. (Same setup as one of the problems covered in class.) Fully loaded barges arrive at night in New Orleans following their long trips down
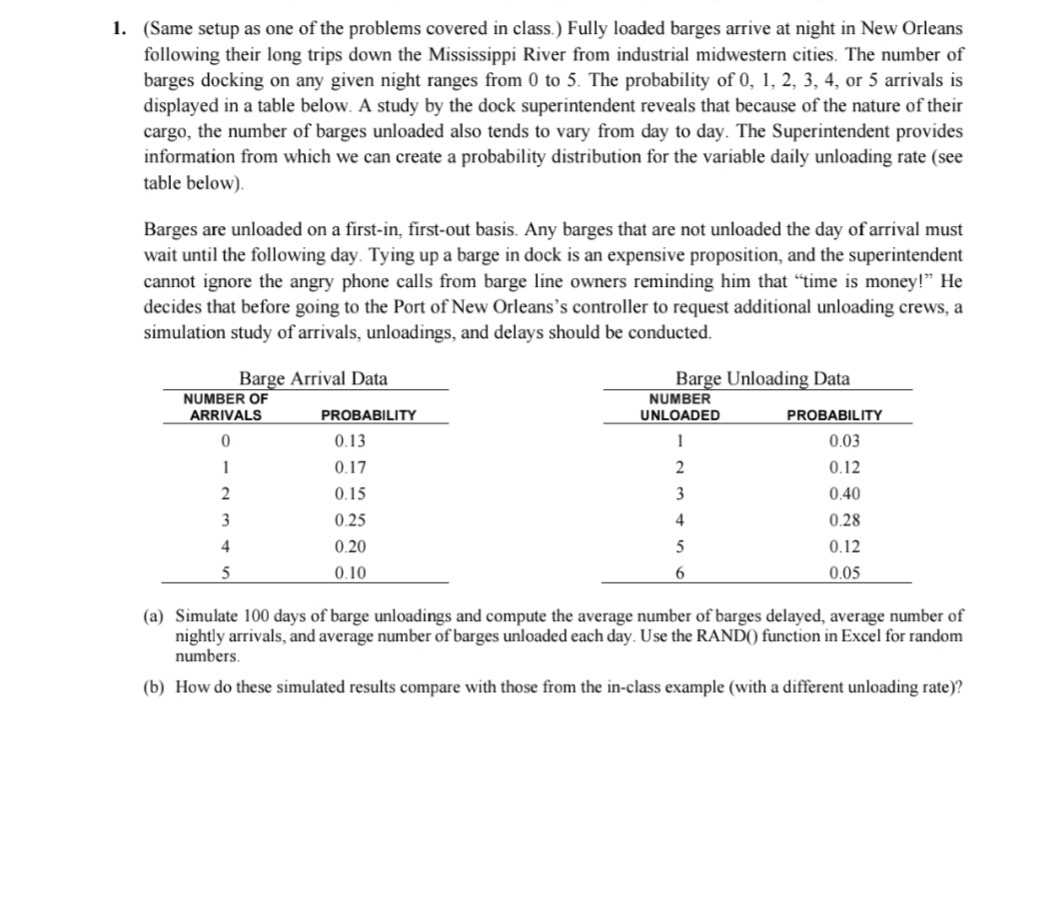
1. (Same setup as one of the problems covered in class.) Fully loaded barges arrive at night in New Orleans following their long trips down the Mississippi River from industrial midwestern cities. The number of barges docking on any given night ranges from 0 to 5. The probability of 0, 1, 2, 3, 4, or 5 arrivals is displayed in a table below. A study by the dock superintendent reveals that because of the nature of their cargo, the number of barges unloaded also tends to vary from day to day. The Superintendent provides information from which we can create a probability distribution for the variable daily unloading rate (see table below) Barges are unloaded on a first-in, first-out basis. Any barges that are not unloaded the day of arrival must wait until the following day. Tying up a barge in dock is an expensive proposition, and the superintendent cannot ignore the angry phone calls from barge line owners reminding him that time is money!" He decides that before going to the Port of New Orleans's controller to request additional unloading crews, a simulation study of arrivals, unloadings, and delays should be conducted. Barge Arrival Data NUMBER OF ARRIVALS PROBABILITY 0.13 0.17 Barge Unloading Data NUMBER UNLOADED PROBABILITY 0.03 0.12 0.40 (0.28 0.12 0.05 0.15 0.25 0.20 0.10 (a) Simulate 100 days of barge unloadings and compute the average number of barges delayed, average number of nightly arrivals, and average number of barges unloaded each day. Use the RAND() function in Excel for random numbers. (b) How do these simulated results compare with those from the in-class example (with a different unloading rate)? 1. (Same setup as one of the problems covered in class.) Fully loaded barges arrive at night in New Orleans following their long trips down the Mississippi River from industrial midwestern cities. The number of barges docking on any given night ranges from 0 to 5. The probability of 0, 1, 2, 3, 4, or 5 arrivals is displayed in a table below. A study by the dock superintendent reveals that because of the nature of their cargo, the number of barges unloaded also tends to vary from day to day. The Superintendent provides information from which we can create a probability distribution for the variable daily unloading rate (see table below) Barges are unloaded on a first-in, first-out basis. Any barges that are not unloaded the day of arrival must wait until the following day. Tying up a barge in dock is an expensive proposition, and the superintendent cannot ignore the angry phone calls from barge line owners reminding him that time is money!" He decides that before going to the Port of New Orleans's controller to request additional unloading crews, a simulation study of arrivals, unloadings, and delays should be conducted. Barge Arrival Data NUMBER OF ARRIVALS PROBABILITY 0.13 0.17 Barge Unloading Data NUMBER UNLOADED PROBABILITY 0.03 0.12 0.40 (0.28 0.12 0.05 0.15 0.25 0.20 0.10 (a) Simulate 100 days of barge unloadings and compute the average number of barges delayed, average number of nightly arrivals, and average number of barges unloaded each day. Use the RAND() function in Excel for random numbers. (b) How do these simulated results compare with those from the in-class example (with a different unloading rate)
Step by Step Solution
There are 3 Steps involved in it

Get step-by-step solutions from verified subject matter experts