

Question: can you please help me with this problem? I will upvote Fully loaded barges arrive at night in a certain port following their long trips
can you please help me with this problem? I will upvote 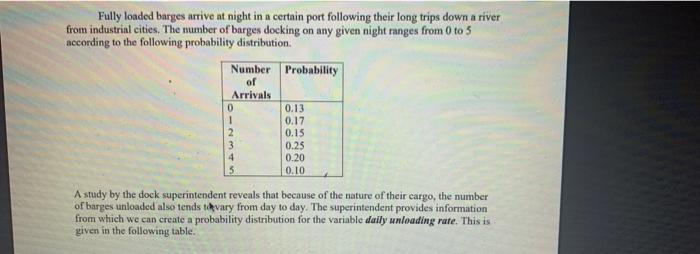
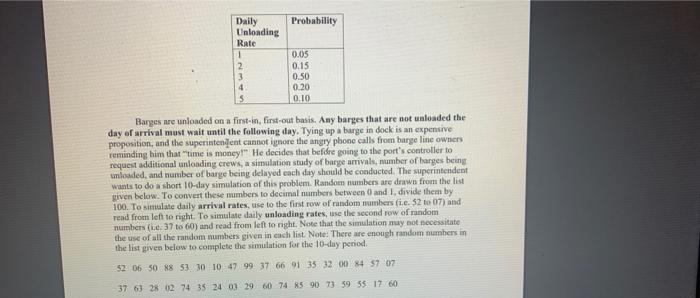
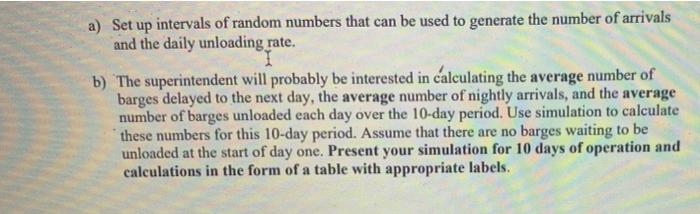
Fully loaded barges arrive at night in a certain port following their long trips down a river from industrial cities. The number of barges docking on any given night ranges from 0 to 5 according to the following probability distribution. Number Probability of Arrivals 0 0.13 1 0.17 2 0.15 3 0.25 4 0.20 5 0.10 A study by the dock superintendent reveals that because of the nature of their cargo, the number of barges unloaded also tends to vary from day to day. The superintendent provides information from which we can create a probability distribution for the variable daily unloading rate. This is given in the following table. Probability Daily Unloading Rate 1 2 3 4 5 0.05 0.15 0.50 0.20 0.10 Barges are unloaded on a first-in, first-out basis. Any barges that are not unloaded the day of arrival must wait until the following day. Tying up a barge in dock is an expensive proposition, and the superintendent cannot ignore the angry phone calls from barge line owners reminding him that time is money?" He decides that before going to the port's controller to request additional unloading crews, a simulation study of barye amivals, number of burges being unloaded, and number of bare being delayed each day should be conducted. The superintendent wants to do a short 10-day simulation of this problem. Random numbers are drawn from the list given below. To convert these numbers to decimal numbers between 0 and I divide them by 100. To simulate daily arrival rates, use to the first row of random numbers fi.e. 52 to 07) and read from left to right. To simulate daily unloading rates, use the second row of random numbers (e 37 to 60) and read from left to night. Note that the simulation may not necessitate the use of all the random numbers given in cache list. Note: There are enough random numbers in the list given below to complete the simulation for the 10-day period 52 06 50 88 53 30 10 47 99 37 66 91 35 32 00 84 57 07 37 63 23 02 74 35 24 03 29 60 74 85 90 73 59 55 17 60 a) Set up intervals of random numbers that can be used to generate the number of arrivals and the daily unloading rate. 1 b) The superintendent will probably be interested in calculating the average number of barges delayed to the next day, the average number of nightly arrivals, and the average number of barges unloaded each day over the 10-day period. Use simulation to calculate these numbers for this 10-day period. Assume that there are no barges waiting to be unloaded at the start of day one. Present your simulation for 10 days of operation and calculations in the form of a table with appropriate labels
Step by Step Solution
There are 3 Steps involved in it
1 Expert Approved Answer
Step: 1 Unlock

Question Has Been Solved by an Expert!
Get step-by-step solutions from verified subject matter experts
Step: 2 Unlock
Step: 3 Unlock