

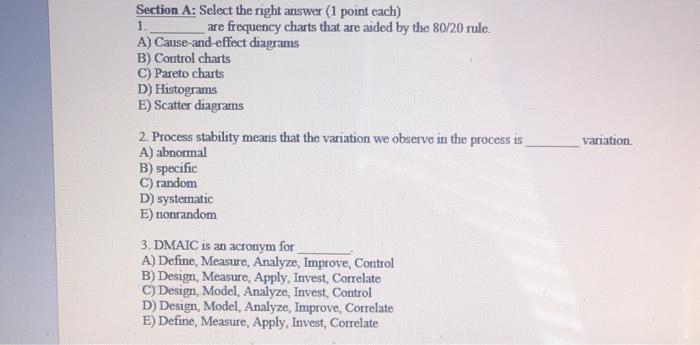
Question: 1 Section A: Select the right answer (1 point each) are frequency charts that are aided by the 80/20 rule. A) Cause and effect diagrams
Step by Step Solution
There are 3 Steps involved in it
1 Expert Approved Answer
Step: 1 Unlock

Question Has Been Solved by an Expert!
Get step-by-step solutions from verified subject matter experts
Step: 2 Unlock
Step: 3 Unlock