

Question: Please help with questions 1-4 on this case study Step 1: Read the following: timagine that you are a SixSigma trained consultant. After interviewing Juanita
Please help with questions 1-4 on this case study 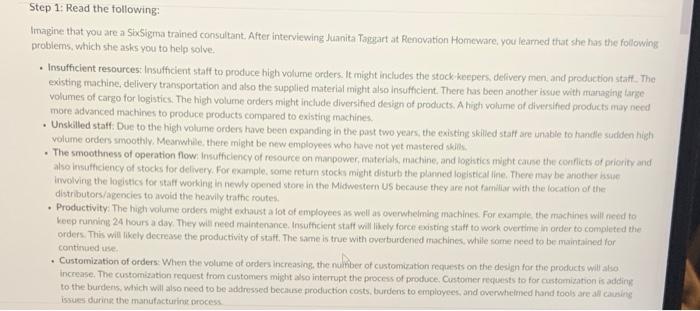
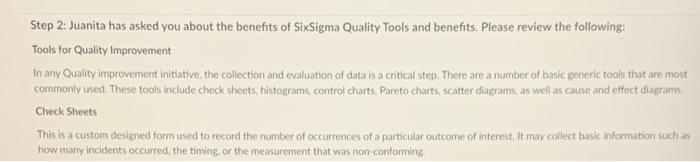
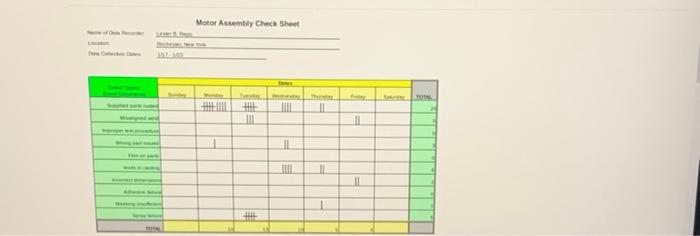

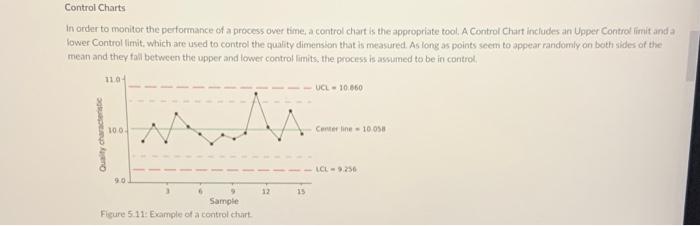
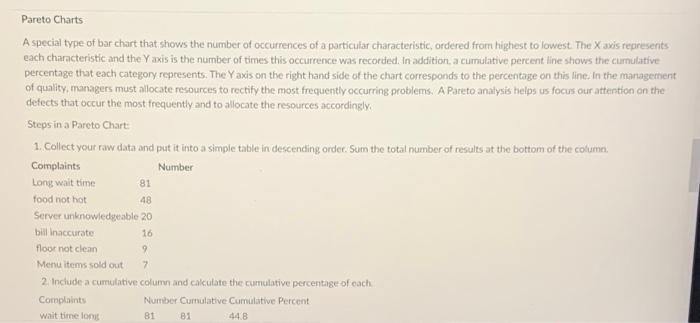
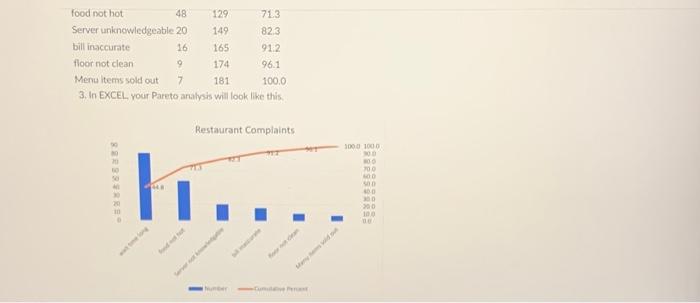
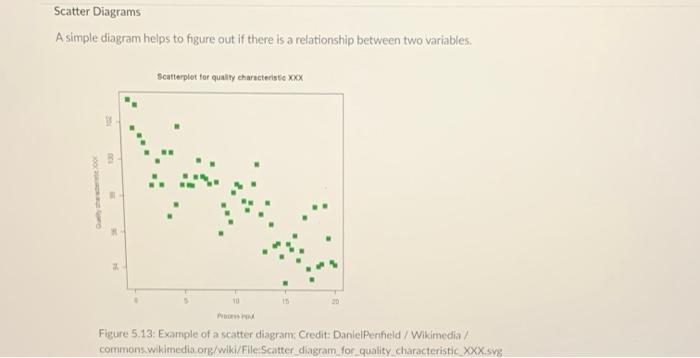
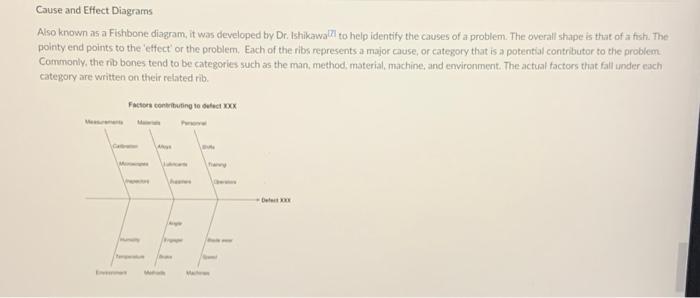
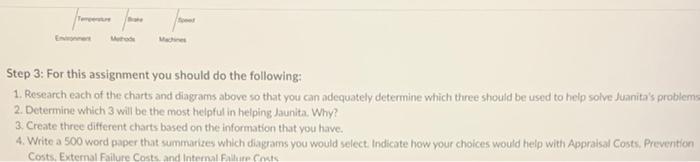
Step 1: Read the following: timagine that you are a SixSigma trained consultant. After interviewing Juanita Tazzart at Renovation Homeware, you learned that she has the following problems which she asks you to help solve. Insufficient resources: Insufficient statt to produce high volume orders. It might includes the stock keepers, delivery men and production statt. The existing machine, delivery transportation and also the supplied material might also insufficient. There has been another issue with managing large volumes of cargo for logistics. The high volume orders might include diversified design of products. A high volume of diversified products may need more advanced machines to produce products compared to existing machines Unskilled statt. Due to the high volume orders have been expanding in the past two years, the existing skilled staff are unable to handle sudden high volume orders smoothly. Meanwhile, there might be new employees who have not yet mastered skills The smoothness of operation flow. Insufficiency of resource on manpower, materials, machine, and loghtics might cause the conflicts of priority and also insufficiency of stocks for delivery. For example, some return stocks might disturb the planned loptical line. There may be another se involving the logistics for statt working in newly opened store in the Midwestern US because they are not familiar with the location of the distributors/agencies to avoid the heavily trathic routes Productivity: The high volume orders might exhaust a fot of employees as well as overwhelming machines. For example the machines will need to keep running 24 hours a day. They will need maintenance. Insuficient start will likely force existing staff to work overtime in order to completed the orders. This will likely decrease the productivity of statt. The same is true with overturdened machines, while some need to be maintained for continued use Customization of orders: When the volume otorders increasing the number of customization requests on the design for the products will also Increase. The customization request from customers might also interrupt the process of produce. Customer requests to for customization is adding to the burders, which will also need to be addressed because production costs, burdens to employees and overwhelmed hand tools are all causing issues during the manufacturint process Step 2: Juanita has asked you about the benefits of SixSigma Quality Tools and benefits. Please review the following: Tools for Quality Improvement In any Quality improvement initiative, the collection and evaluation of data is a critical step. There are a number of basic generic tools that are most commonly used. These tools include check sheets, histograms, control charts. Pareto charts, scatter diagrams, as well as cause and effect diagrams Check Sheets This is a custom designed form used to record the number of occurrences of a particular outcome of interest. It may collect basic information such as how many incidents occurred, the timing or the measurement that was non-conforming Motor Assembly Check Sheet SO THE 11 11 1 11 11 Histograms Raw data from a check sheet may be put into a histogram. Data that is continuous in nature can be put into a Histogram that contains ranges of the data. It will show an accurate representation of the distribution of the data Figure 5.10. Example of a histogram. Control Charts In order to monitor the performance of a process over time, a control chart is the appropriate tool. A Control Chart includes an Upper Control imit and a fower Controllimit, which are used to control the quality dimension that is measured. As long as points scem to appear randomly on both sides of the mean and they fall between the upper and lower control limits. the process is assumed to be in control 110 UCL - 10.560 100 Centerline - 10058 I. 90 12 15 Sample Figure 5.11 Example of a control churt Pareto Charts A special type of bar chart that shows the number of occurrences of a particular characteristic ordered from highest to lowest. The X axis represents each characteristic and the Yaxis is the number of times this occurrence was recorded. In addition, a cumulative percent line shows the cumulative percentage that each category represents. The Yaxis on the right hand side of the chart corresponds to the percentage on this line. In the management of quality managers must allocate resources to rectify the most frequently occurring problems. A Pareto analysis helps us focus our attention on the defects that occur the most frequently and to allocate the resources accordingly Steps in a Pareto Chart 1. Collect your raw data and put it into a simple table in descending order. Sum the total number of results at the bottom of the columo, Complaints Number Long wait time 81 food not hot Server unknowledgeable 20 bill Inaccurate floor not clean 9 Menu items sold out 7 2. Include a cumulative column and calculate the cumulative percentage of each Complaints Number Cumulative Comulative Percent wait time lot 81 1 448 48 16 48 food not hot 129 713 Server unknowledgeable 20 149 82.3 bill inaccurate 16 165 912 floor not clean 9 174 96.1 Menu Items sold out 7 181 100,0 3. In EXCEL Your Paruto analysis will look like this. Restaurant Complaints 1000 1000 00 11... 00 00 00 100 Scatter Diagrams A simple diagram helps to figure out if there is a relationship between two variables. Scatterplot for quality characteristic XXX 90 Figure 5.13: Example of a scatter diagram: Credit: Daniel Perheld/Wikimedia/ commons.wikimedia.org/wiki/File:Scatter diagram for quality characteristic XXX.svg Cause and Effect Diagrams Also known as a Fishbone diagram, it was developed by Dr. Ishikawall to help identify the causes of a problem. The overall shape is that of a fish. The pointy end points to the effect or the problem. Each of the ribs represents a major cause, or category that is a potential contributor to the problem Commonly, the rib bones tend to be categories such as the man, method material machine, and environment. The actual factors that fall under each Category are written on their related rib. Factor contributing to let XXX -Dent To meran Med Step 3: For this assignment you should do the following: 1. Research each of the charts and diagrams above so that you can adequately determine which three should be used to help solve Juanita's problems 2. Determine which 3 will be the most helpful in helping Jaunita. Why? 3. Create three different charts based on the information that you have. 4. Write a 500 word paper that summarizes which diagrams you would select Indicate how your choices would help with Appraisal Costs. Preverition Costs. External Failure Costs and Internal Fale Costs Step by Step Solution
There are 3 Steps involved in it
1 Expert Approved Answer
Step: 1 Unlock

Question Has Been Solved by an Expert!
Get step-by-step solutions from verified subject matter experts
Step: 2 Unlock
Step: 3 Unlock