

Question: 1. Select the statement that most accurately describes the data represented by the boxplot below. 8 8 A. Approximately 25%% of the data lies between
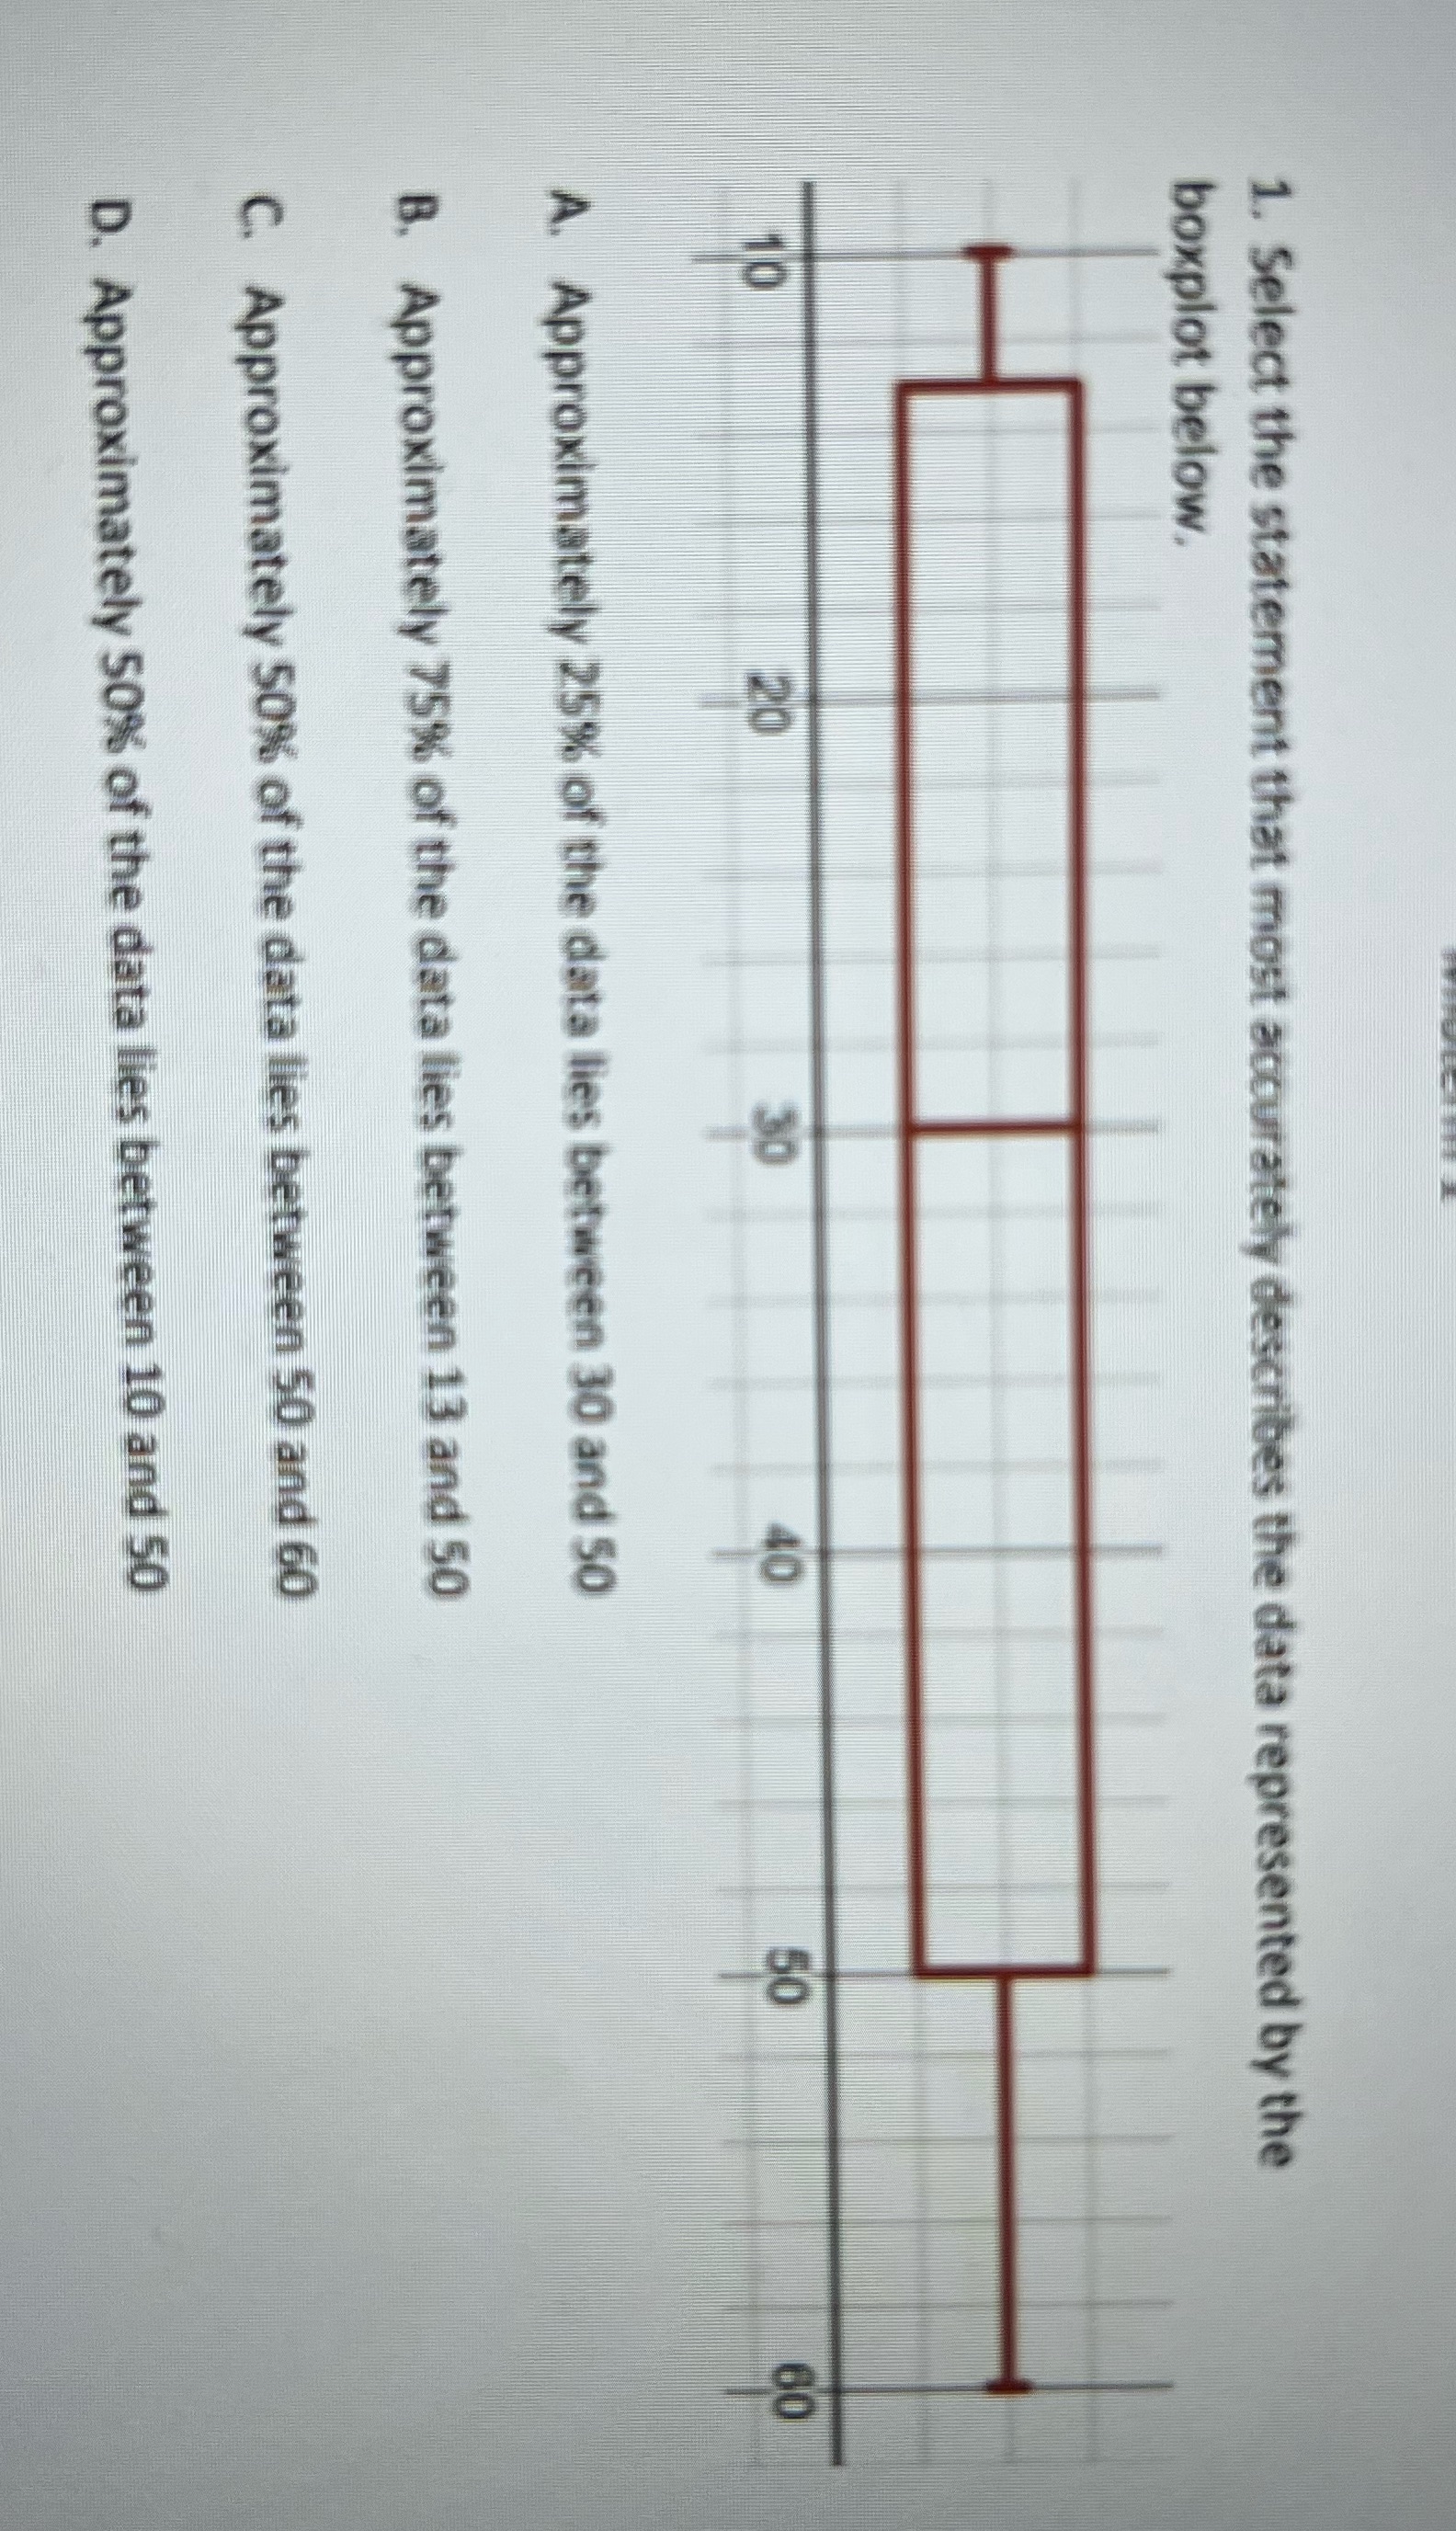
1. Select the statement that most accurately describes the data represented by the boxplot below. 8 8 A. Approximately 25%% of the data lies between 30 and 50 B. Approximately 75% of the data lies between 13 and 50 C. Approximately 50% of the data lies between 50 and 60 D. Approximately 50% of the data lies between 10 and 50
Step by Step Solution
There are 3 Steps involved in it
1 Expert Approved Answer
Step: 1 Unlock

Question Has Been Solved by an Expert!
Get step-by-step solutions from verified subject matter experts
Step: 2 Unlock
Step: 3 Unlock