

Question: 1. Simple Regression in a Spreadsheet Suppose you have the following data on 11 student's combined SAT scores (X) and their cumu- lative grade
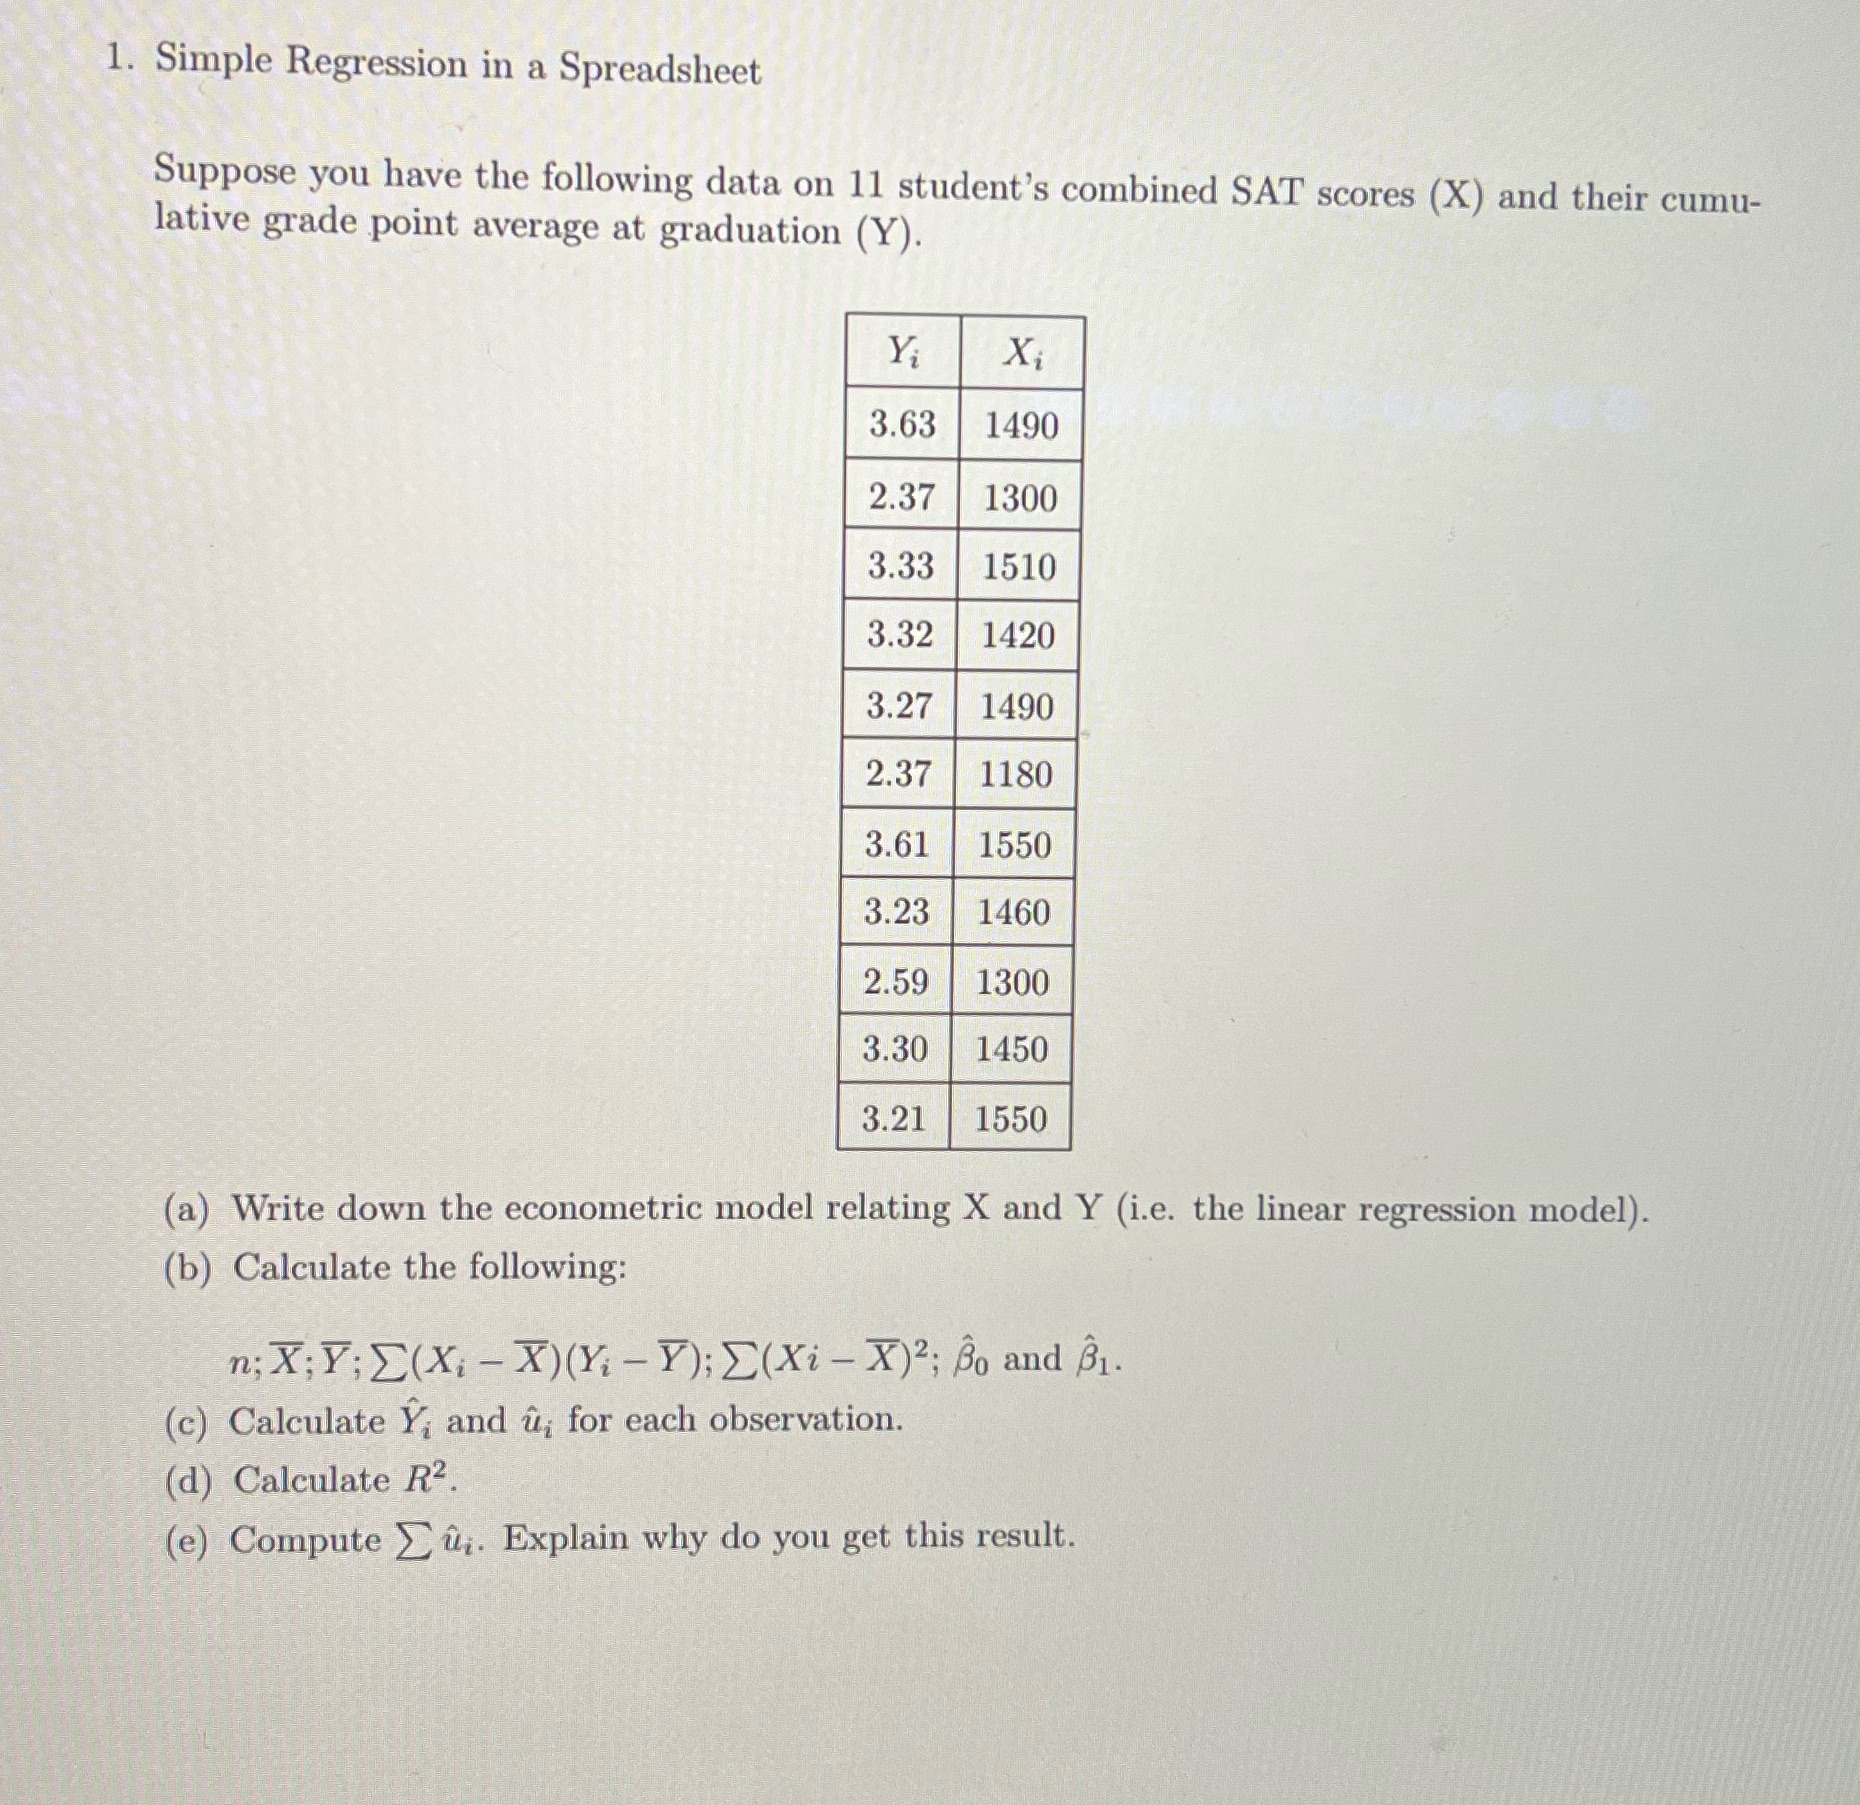
1. Simple Regression in a Spreadsheet Suppose you have the following data on 11 student's combined SAT scores (X) and their cumu- lative grade point average at graduation (Y). Yi Xi 3.63 1490 2.37 1300 3.33 1510 3.32 1420 3.27 1490 2.37 1180 3.61 1550 3.23 1460 2.59 1300 3.30 1450 3.21 1550 (a) Write down the econometric model relating X and Y (i.e. the linear regression model). (b) Calculate the following: n; X;Y; (XX)(Yi - Y); (Xi - X); Bo and B. (c) Calculate ; and , for each observation. (d) Calculate R. (e) Compute. Explain why do you get this result.
Step by Step Solution
There are 3 Steps involved in it
1 Expert Approved Answer
Step: 1 Unlock

Question Has Been Solved by an Expert!
Get step-by-step solutions from verified subject matter experts
Step: 2 Unlock
Step: 3 Unlock