

Refer to the Research in Nursing & Health (Vol. 35, 2012) study of the effectiveness of a
Question:
Refer to the Research in Nursing & Health (Vol. 35, 2012) study of the effectiveness of a pain intervention, Exercise 16.9. Recall that pain levels (measured on a 100-point scale) were recorded for a sample of 10 ICU patients 24-hours post-surgery each week for 20 consecutive weeks. The data are repeated in the accompanying table. Now, you want to check process variation using an R-chart
a. Compute the centerline for the chart.
b. Compute the UCL and LCL for the R-chart.
c. Plot the ranges for the 20 weeks on the R-chart. Does the variation of the pain management process appear to be “in control”?
d. Recall that after the 20th week, a pain intervention occurred in the ICU. The ranges of the pain levels for the samples of patients over the next eight consecutive weeks were (in order): 22, 29, 16, 15, 23, 19, 30, and 32. Plot these ranges on the R-chart.
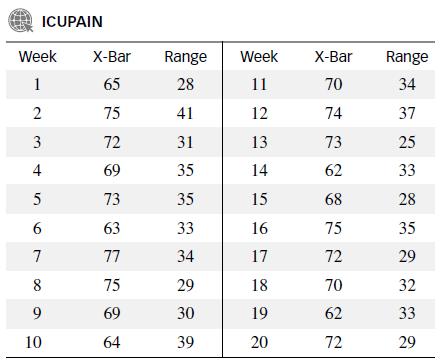
Data from Exercise 16.9
Various interventions are available for nurses to help relieve patients’ pain (e.g., heat/cold applications, breathing exercises, massage). The journal Research in Nursing & Health (Vol. 35, 2012) demonstrated the utility of statistical process control in determining the effectiveness of a pain intervention. The researchers presented the following illustration. Pain levels (measured on a 100-point scale) were recorded for a sample of 10 intensive care unit (ICU) patients 24-hours post-surgery each week for 20 consecutive weeks. The accompanying table provides the means and ranges for each of the 20 weeks. To establish that the pain management process is “in statistical control”, an x-chart is constructed.
Step by Step Answer:

This question has not been answered yet.
You can Ask your question!


Statistics For Engineering And The Sciences
ISBN: 9781498728850
6th Edition
Authors: William M. Mendenhall, Terry L. Sincich
