

Question: 1. Sketch a scatter plot that could represent data from each of the following. Label the axes to indicate the independent and dependent variable. a.
![variable. a. people's ages [starting at 213] and their reaction times b.](https://s3.amazonaws.com/si.experts.images/answers/2024/06/667c667cf2331_732667c667cd3f47.jpg)
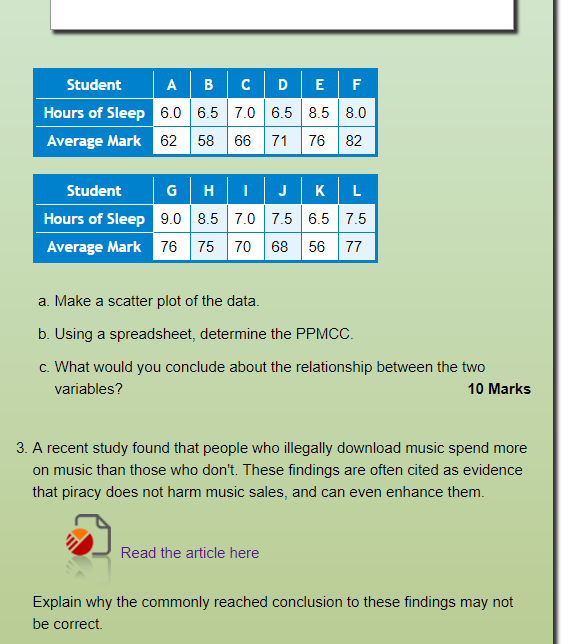
1. Sketch a scatter plot that could represent data from each of the following. Label the axes to indicate the independent and dependent variable. a. people's ages [starting at 213] and their reaction times b. size of a house and its price c. exposure to sunlight and the risk of heart attacks d. size of vocabulary and age [birth to 25 years old} e. oven temperature and the cooking time for a turkey 1t} Marks 2. A study was done with a group of university students to determine if there was a correlation between the amounts of sleep they got and their academic performance. The following table lists some data from the study. Hours of Sleep Average Mark Student Hours of Sleep Average Mark
Step by Step Solution
There are 3 Steps involved in it

Get step-by-step solutions from verified subject matter experts