

Question: The graph of the function f is shown below. Use this graph to sketch the graphs of functions g(x) = -f(-x) - 2 and
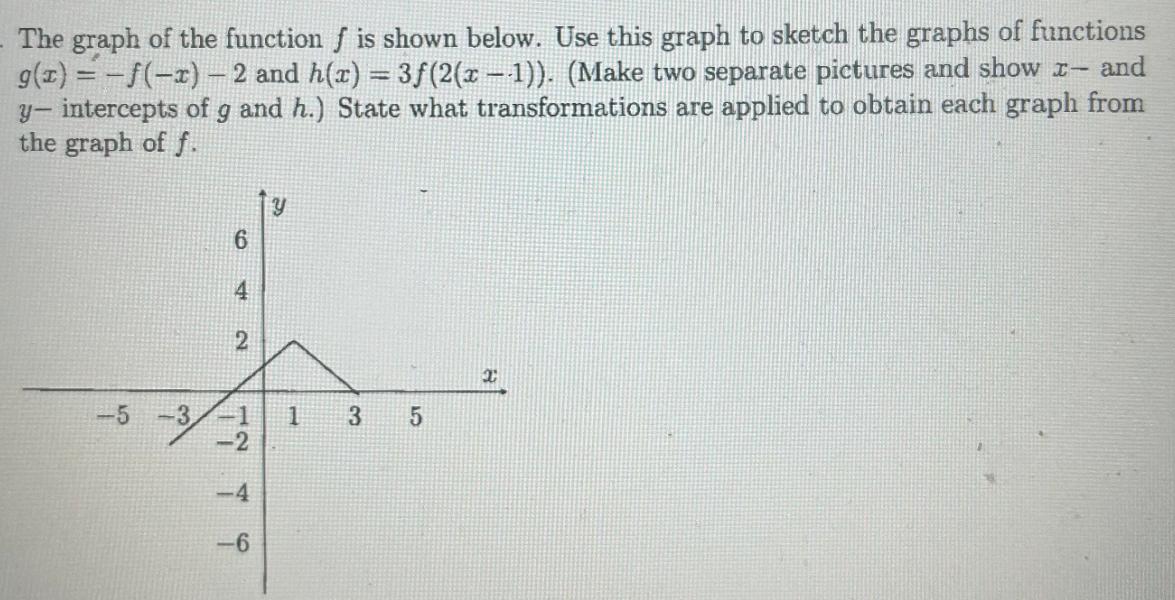
The graph of the function f is shown below. Use this graph to sketch the graphs of functions g(x) = -f(-x) - 2 and h(x) = 3f (2(x -1)). (Make two separate pictures and show - and y- intercepts of g and h.) State what transformations are applied to obtain each graph from the graph of f. -5 2 -2 -6 1 3 ST 5
Step by Step Solution
★★★★★
3.48 Rating (155 Votes )
There are 3 Steps involved in it
1 Expert Approved Answer
Step: 1 Unlock

Difference The method used to determine trade patterns by comparative and absolute advantage differs ... View full answer
Question Has Been Solved by an Expert!
Get step-by-step solutions from verified subject matter experts
Step: 2 Unlock
Step: 3 Unlock