

Question: 1. State the multiple regression equation. (round to one decimal place as needed) 2. Interpret the meaning of the slopes, b1 and b2, in this
1. State the multiple regression equation. (round to one decimal place as needed)
2. Interpret the meaning of the slopes, b1 and b2, in this problem. Choose the correct answer below.
a. For a given number of remote hours, each increase of one unit of total staff present is estimated to result in a mean increase in standby hours of b 1 units. For a given number of total staff present, each increase of one unit in remote hours is estimated to result in a mean decrease in standby hours of the absolute value of b 2 units.
b. For a given number of remote hours, each increase of one unit of total staff present and one unit increase in standby hours is estimated to result in a mean increase in remote hours of b1 and b2 units, respectively.
c. Each increase in standby hours is estimated to result in a mean increase in total staff present of b1units and a mean decrease in remote hours of the absolute value of b2 units.
d. The slopes, b1 and b2, cannot be interpreted individually.
3. Explain why the regression coefficient, b0, has no practical meaning in the context of this problem. Choose the correct answer below.
A.The coefficient b0 has no practical meaning in this context because it estimates the standby hours when there are no staff present and no remote hours.This is the correct answer.
B.The coefficient b0 has no practical meaning in this context because it corresponds to the number of staff present and the remote hours when there are no standby hours. Your answer is not correct.
C.The coefficient b0 has no practical meaning in this context because Y depends on not only b0, but b1 and b2 as well, and their meaning cannot be separated.
D.The coefficient b0 has no practical meaning in this context because it is not close in value to any of the data values in the standby hours column
4. Predict the mean standby hours for a week in which the total staff present have 310 people-days and the remote hours are 400.
There would be ___ standby hours predicted for the week.
5. Construct a 95% confidence interval estimate for the mean standby hours for weeks in which the total staff present have 310 people-days and the remote hours are 400.
The 95% confidence interval estimate is
_____less than or equals mu Subscript Upper Y | Upper X Baseline less than or equalsY | X____.
6. Construct a 95% prediction interval for the standby hours for a single week in which the total staff present have 310 people-days and the remote hours are 400.
The 95% prediction interval for the standby hours is
____less than or equals Upper Y Subscript Upper X Baseline less than or equalsYX____.
7. What conclusions can you reach concerning standby hours?
a. The model can use the number of staff present or the remote hours to predict the number of standby hours, but not both.
b. The model uses both the number of staff present and the remote hours to predict the number of standby hours. This produces a better model than if only one variable were included.
c. The model uses the number of remote hours to predict the number of standby hours. The number of staff present only affects the remote hours directly.
d. The model uses the number of staff present to predict the number of standby hours. The remote hours only affects the number of staff present directly.
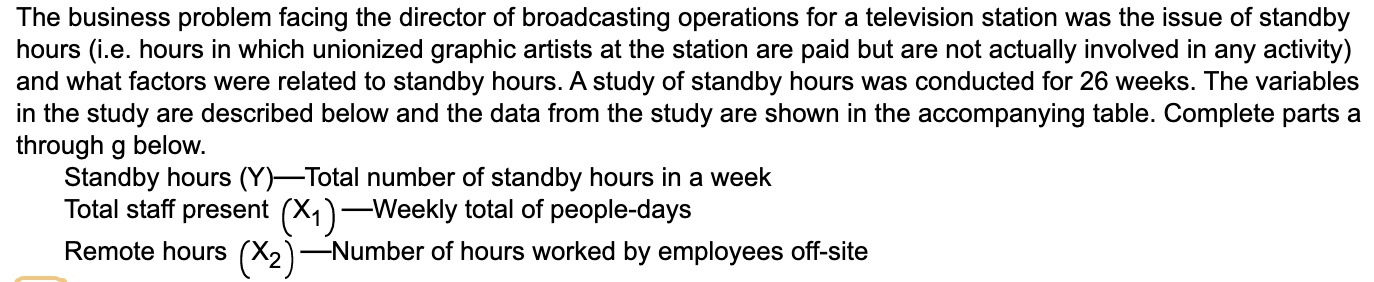
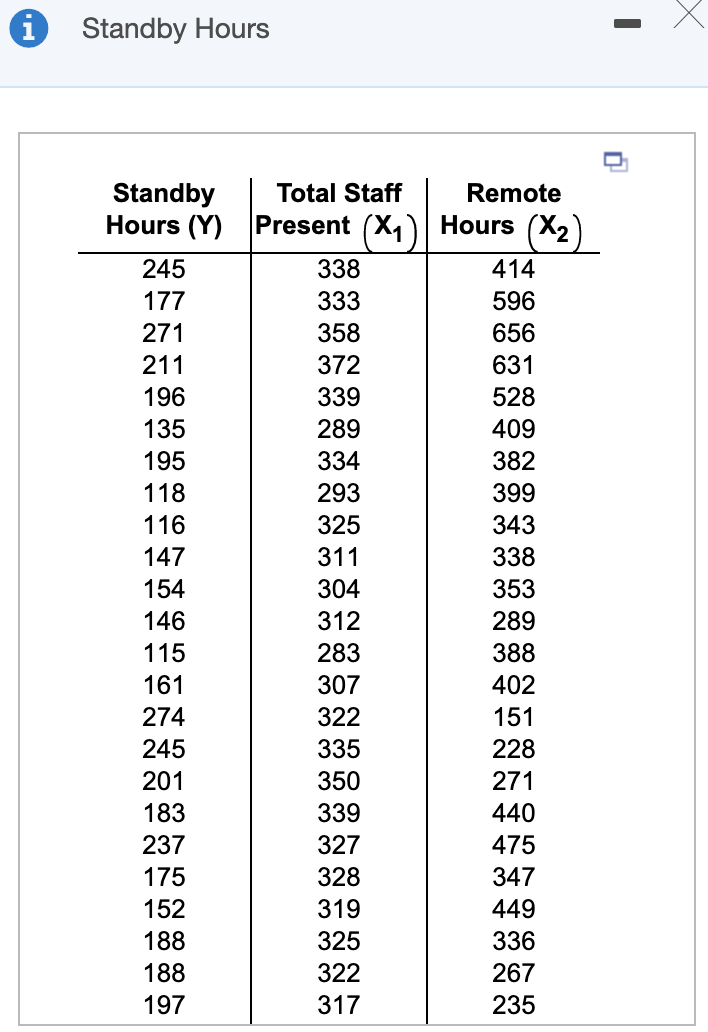
The business problem facing the director of broadcasting operations for a television station was the issue of standby hours (i.e. hours in which unionized graphic artists at the station are paid but are not actually involved in any activity) and what factors were related to standby hours. A study of standby hours was conducted for 26 weeks. The variables in the study are described below and the data from the study are shown in the accompanying table. Complete parts a through g below. Standby hours (Y)Total number of standby hours in a week Total staff present (X1) Weekly total of people-days Remote hours (X2) Number of hours worked by employees off-site Standby Hours Standby Hours (Y) 245 177 271 211 196 135 195 118 116 147 154 146 115 161 274 245 201 183 237 175 152 188 188 197 Total Staff Remote Present (X1) Hours (X2) 338 414 333 596 358 656 372 631 339 528 289 409 334 382 293 399 325 343 311 338 304 353 312 289 283 388 307 402 322 151 335 228 350 271 339 440 327 475 328 347 319 449 325 336 322 267 317 235 The business problem facing the director of broadcasting operations for a television station was the issue of standby hours (i.e. hours in which unionized graphic artists at the station are paid but are not actually involved in any activity) and what factors were related to standby hours. A study of standby hours was conducted for 26 weeks. The variables in the study are described below and the data from the study are shown in the accompanying table. Complete parts a through g below. Standby hours (Y)Total number of standby hours in a week Total staff present (X1) Weekly total of people-days Remote hours (X2) Number of hours worked by employees off-site Standby Hours Standby Hours (Y) 245 177 271 211 196 135 195 118 116 147 154 146 115 161 274 245 201 183 237 175 152 188 188 197 Total Staff Remote Present (X1) Hours (X2) 338 414 333 596 358 656 372 631 339 528 289 409 334 382 293 399 325 343 311 338 304 353 312 289 283 388 307 402 322 151 335 228 350 271 339 440 327 475 328 347 319 449 325 336 322 267 317 235
Step by Step Solution
There are 3 Steps involved in it

Get step-by-step solutions from verified subject matter experts