

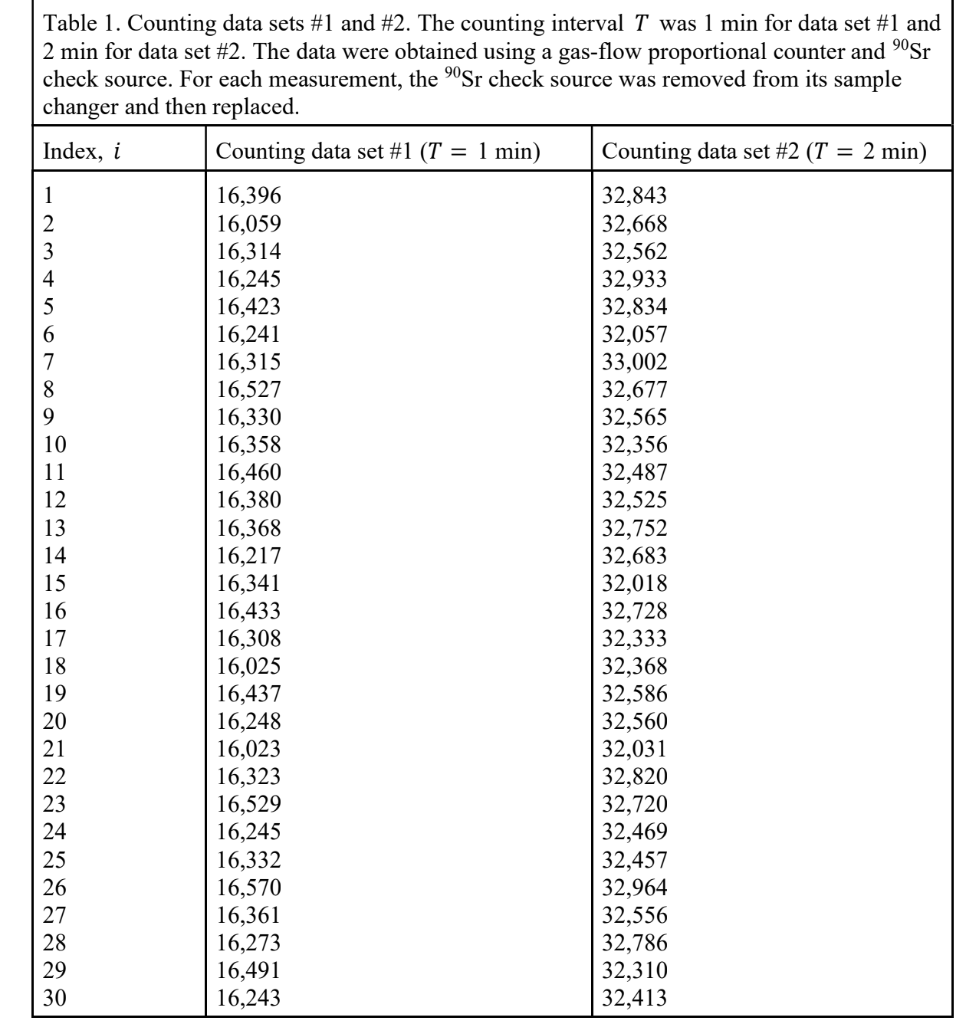
Question: 1) Table 1 below contains two sets of counting data obtained using a gas proportional counter and 90Sr check source. The counting interval for data
1) Table 1 below contains two sets of counting data obtained using a gas proportional counter and 90Sr check source. The counting interval for data set #1 was 1 min, and was 2 min for data set #2. For each measurement, the 90Sr check source was removed from its sample changer and then replaced. For each data set, the background counts were negligible compared to the net counts. 55% a) Calculate all the statistics for each data sets as determined in the example calculations provided in class. Also, perform all the statistical tests and make conclusions to reject or accept the null hypotheses of Poisson variance, acceptable randomness, and acceptable normality based on the test results. To make your conclusions, use the same type I error probability of 0.05 in each tail when performing hypothesis tests. 10% b) For each data set, report the 95% occurrence interval for the counts (C), and the 95% confidence interval for the sample means (C). 10% c) For each data set, determine the relative variance for the counts and the relative variance for the sample means. 10% d) For each data set, determine the average counting rate (R) and its standard deviation (in units of counts per second), and determine the standard deviation for the counting rates (R). 15% e) Discuss the different conclusions reached for each data set, and why one data set may be more effective than the other for detecting the existence of non-Poisson variance.
Step by Step Solution
There are 3 Steps involved in it

Get step-by-step solutions from verified subject matter experts