

Question: 1. Tabulate the sieve analysis data of the feed material and -P1 fraction of the last grind. 2. Determine the best method to plot the
1. Tabulate the sieve analysis data of the feed material and -P1 fraction of the last grind. 2. Determine the best method to plot the cumulative weight percent passing versus sieve size (in m) for both analyses and justify your choice. Determine the d80 for both data sets. 3. Calculate grindability (G). 4. Calculate Wi for your grindability. Compare with typical published values for your material. Comment on any discrepancy. Note that P80 in Eq. 2 is based on the -P1 fraction of the ball mill product. 5. Calculate the net power required to grind the -6 mesh feed material to 80% passing 400 mesh for a 10,000 tpd plant; use Wi as determined by your group. 6. Select the size and number of ball mills required to dry grind 50,000 tpd of the same -6 mesh feed to 80% passing 400 mesh. Assume the mill would operate at 75% critical speed and 40 vol.% ball charge.
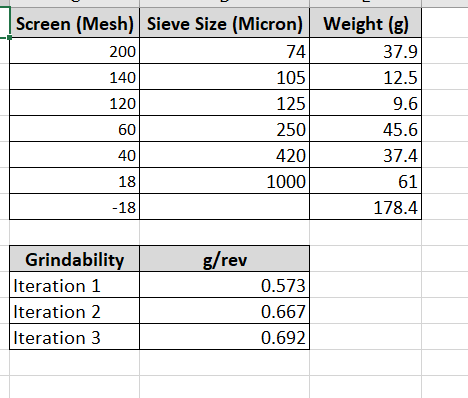
Screen (Mesh) Sieve Size (Micron) Weight (g) 200 74 37.9 140 105 12.5 120 125 9.6 60 250 45.6 40 420 37.4 18 1000 61 -18 178.4 g/rev Grindability Iteration 1 Iteration 2 Iteration 3 0.573 0.667 0.692 Screen (Mesh) Sieve Size (Micron) Weight (g) 200 74 37.9 140 105 12.5 120 125 9.6 60 250 45.6 40 420 37.4 18 1000 61 -18 178.4 g/rev Grindability Iteration 1 Iteration 2 Iteration 3 0.573 0.667 0.692
Step by Step Solution
There are 3 Steps involved in it

Get step-by-step solutions from verified subject matter experts