Question: 1. The analyst in the Dorben Reference Library decides to use the work sampling technique to establish standards. Twenty employees are involved. The operations include
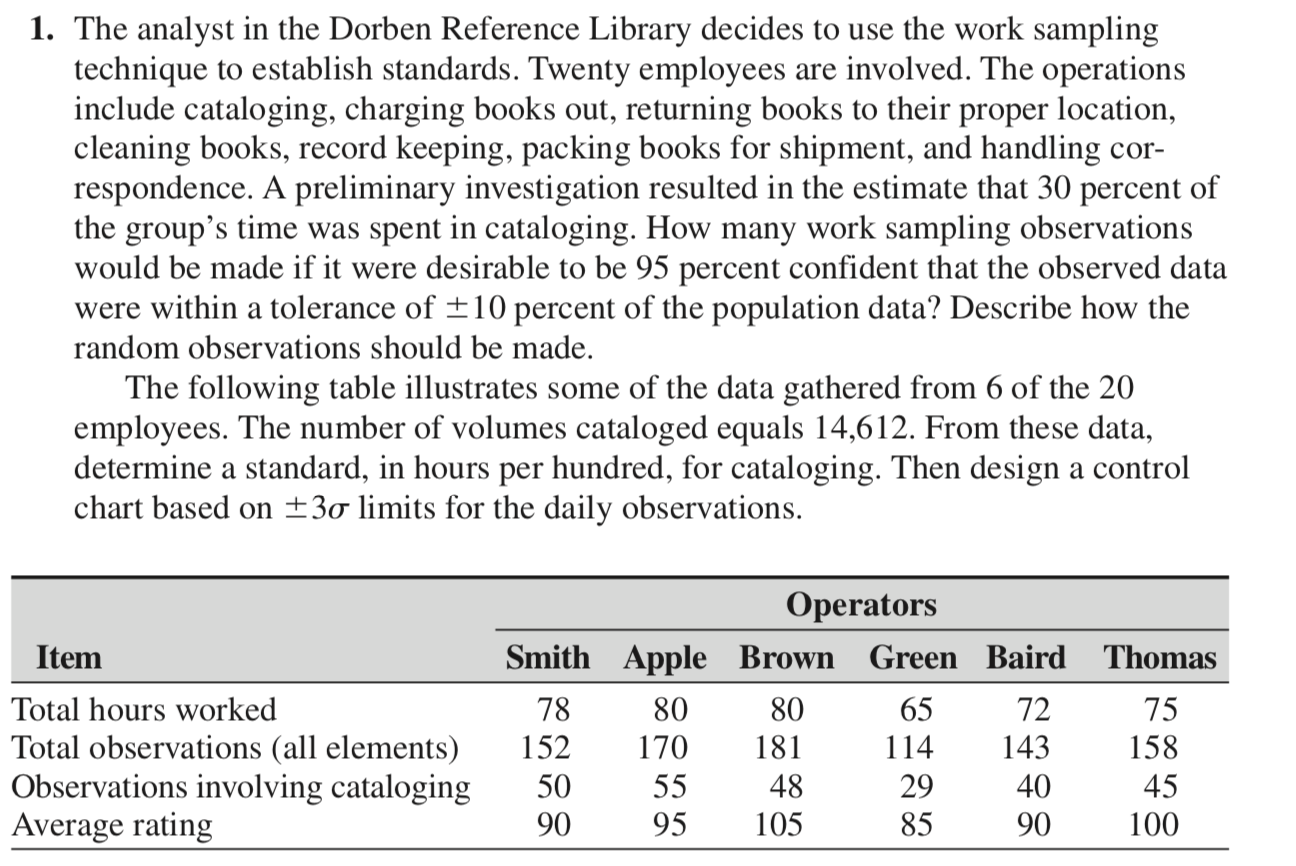
1. The analyst in the Dorben Reference Library decides to use the work sampling technique to establish standards. Twenty employees are involved. The operations include cataloging, charging books out, returning books to their proper location, cleaning books, record keeping, packing books for shipment, and handling cor- respondence. A preliminary investigation resulted in the estimate that 30 percent of the group's time was spent in cataloging. How many work sampling observations would be made if it were desirable to be 95 percent confident that the observed data were within a tolerance of 10 percent of the population data? Describe how the random observations should be made. The following table illustrates some of the data gathered from 6 of the 20 employees. The number of volumes cataloged equals 14,612. From these data, determine a standard, in hours per hundred, for cataloging. Then design a control chart based on +3o limits for the daily observations. Item Total hours worked Total observations (all elements) Observations involving cataloging Average rating Operators Smith Apple Brown Green Baird 78 80 80 65 72 152 170 181 114 143 50 55 48 29 40 90 95 105 85 90 Thomas 75 158 45 100 1. The analyst in the Dorben Reference Library decides to use the work sampling technique to establish standards. Twenty employees are involved. The operations include cataloging, charging books out, returning books to their proper location, cleaning books, record keeping, packing books for shipment, and handling cor- respondence. A preliminary investigation resulted in the estimate that 30 percent of the group's time was spent in cataloging. How many work sampling observations would be made if it were desirable to be 95 percent confident that the observed data were within a tolerance of 10 percent of the population data? Describe how the random observations should be made. The following table illustrates some of the data gathered from 6 of the 20 employees. The number of volumes cataloged equals 14,612. From these data, determine a standard, in hours per hundred, for cataloging. Then design a control chart based on +3o limits for the daily observations. Item Total hours worked Total observations (all elements) Observations involving cataloging Average rating Operators Smith Apple Brown Green Baird 78 80 80 65 72 152 170 181 114 143 50 55 48 29 40 90 95 105 85 90 Thomas 75 158 45 100


