

Question: 1 . The attached excel file includes the raw data ( which has not been reviewed for errors ) . A second tab includes graphs
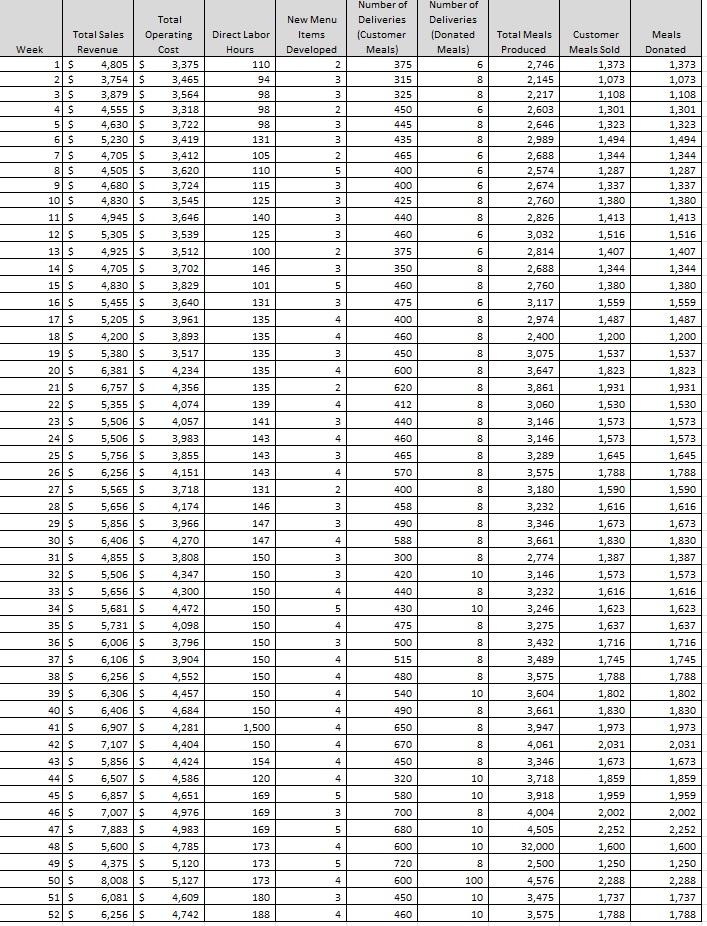
The attached excel file includes the raw data which has not been reviewed for errors A second tab includes graphs that provide a visual analysis of each of the possible cost drivers against total operating cost. Review the results to determine if there are any outliers that should be corrected. It is noted that the intern has been known to have made mistakes in data entry before by entering double zeroes on accident. Also, there are no other known errors or outliers that should have occurred. Using the graphs, determine if there are any situations where this has occurred.
If any errors are discovered, they should be corrected not deleted and you should use the cleanedup data file for the remainder of this assignment.
Part Cost Driver Analysis uncleaned data with graphsxlsx
Using the cleaned data, prepare a correlation matrix showing the relationship among all of the variables.
a Which variable has the strongest correlation with total operating cost?
a What is the correlation?
b Which variable has the weakest correlation with total operating cost
b What is the correlation?
c Does it make sense to analyze the total number of meals produced, the number of meals sold, and the number of meals donated as separate variables?
Prepare a visual diagram of the relationship between total operating cost and the single best driver identified in question a above. Add a regression trend line to the graph.
a What is the estimate of weekly fixed cost?
b What is the estimate of variable cost per unit of x
Note: Round your answer to the nearest cent two decimal places
c What percentage of the variation in operating cost can be explained by the single best cost driver?
Step by Step Solution
There are 3 Steps involved in it
1 Expert Approved Answer
Step: 1 Unlock

Question Has Been Solved by an Expert!
Get step-by-step solutions from verified subject matter experts
Step: 2 Unlock
Step: 3 Unlock