

Question: Instructions: The attached excel file includes the raw data (which has not been reviewed for errors). A second tab includes graphs that provide a visual
Instructions:
The attached excel file includes the raw data (which has not been reviewed for errors). A second tab includes graphs that provide a visual analysis of each of the possible cost drivers against total operating cost. Review the results to determine if there are any outliers that should be corrected. It is noted that the intern has been known to have made mistakes in data entry before by entering double zeroes on accident. Also, there are no other known errors or outliers that should have occurred. Using the graphs, determine if there are any situations where this has occurred.
If any errors are discovered, they should be corrected (not deleted), and you should use the cleaned-up data file for the remainder of this assignment.
Questions:
3. Prepare a visual diagram of the relationship between total operating cost and the single best driver identified in question 2a above. Add a regression trend line to the graph.
a. What is the estimate of weekly fixed cost?
Round your answer to the nearest whole dollar.
b. What is the estimate of variable cost per unit of x?
Note: Round your answer to the nearest cent (two decimal places).
c. What percentage of the variation in operating cost can be explained by the single best cost driver?
Note: Round your answer to the nearest whole percentage (e.g., 0.195 = 20%).
4. Run a multiple regression that includes five possible cost drivers. You should omit any redundant variables that are perfectly correlated.
a. What percentage of the total variation in operating cost can be explained by all five cost drivers combined?
Note: Round your answer to the nearest whole percentage.
b. What percentage of the variation in operating cost is NOT explained this by this model?
Note: Round your answer to the nearest whole percentage.
5. Use the multiple regression model to predict the total annual operating cost for next year if the company expects 170,000 total meals produced (donated and customer meals combined), 8,000 direct labor hours, 30,000 meal kits delivered, 150 new menu items, and 750 shipments of donated meals.
Be sure to multiply the intercept by 52 weeks to convert from weekly to annual fixed cost.
Note: Round your final answer to the nearest $10,000 (to avoid rounding errors in the individual coefficients).
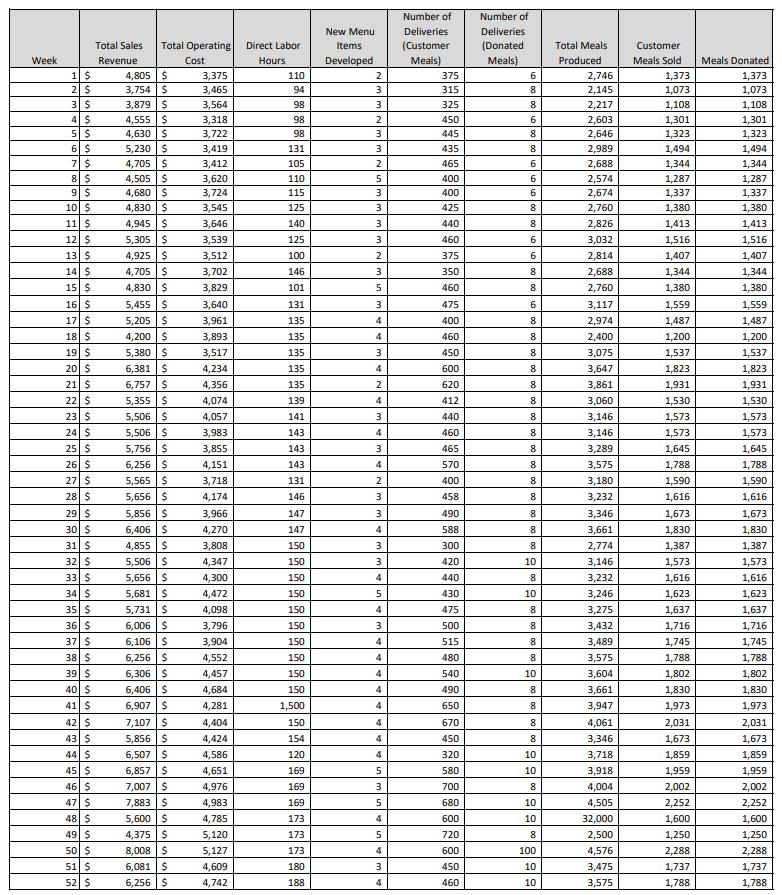
Number of Number of New Menu Total Sales Total Operating Direct Labor Week Revenue Cost Hours Items Developed Deliveries (Customer Deliveries (Donated Total Meals Customer Meals) Meals) Produced Meals Sold Meals Donated 1 $ 4,805 $ 3,375 110 2 375 6 2,746 1,373 1,373 2 $ 3,754 $ 3,465 94 3. 315 8 2,145 1,073 1,073 3 S 3,879 $ 3,564 98 3 325 8 2,217 1,108 1,108 4 S 4,555 $ 3,318 98 2 450 6 2,603 1,301 1,301 5 S 4,630 $ 3,722 98 3 445 8 2,646 1,323 1,323 6 $ 5,230 $ 3,419 131 3 435 8 2,989 1,494 1,494 7 $ 4,705 $ 3,412 105 2 465 6 2,688 1,344 1,344 8 $ 4,505 $ 3,620 110 5 400 6 2,574 1,287 1,287 9 $ 4,680 $ 3,724 115 3 400 6 2,674 1,337 1,337 10 $ 4,830 $ 3,545 125 3 425 8 2,760 1,380 1,380 11 $ 4,945 $ 3,646 140 3 440 8 2,826 1,413 1,413 12 $ 5,305 $ 3,539 125 3 460 6 3,032 1,516 1,516 13 S 4,925 $ 3,512 100 2 375 6 2,814 1,407 1,407 14 S 4,705 $ 3,702 146 3 350 8 2,688 1,344 1,344 15 $ 4,830 $ 3,829 101 5 460 8 2,760 1,380 1,380 16 S 5,455 $ 3,640 131 3 475 6 3,117 1,559 1,559 17 S 5,205 $ 3,961 135 4 400 8 2,974 1,487 1,487 18 $ 4,200 $ 3,893 135 4 460 8 2,400 1,200 1,200 19 $ 5,380 $ 3,517 135 3 450 8 3,075 1,537 1,537 20 $ 6,381 $ 4,234 135 4 600 8 3,647 1,823 1,823 21 $ 6,757 $ 4,356 135 2 620 8 3,861 1,931 1,931 22 $ 5,355 $ 4,074 139 4 412 8 3,060 1,530 1,530 23 $ 5,506 $ 4,057 141 3 440 8 3,146 1,573 1,573 24 $ 5,506 $ 3,983 143 4 460 8 3,146 1,573 1,573 25 $ 5,756 $ 3,855 143 3 465 8 3,289 1,645 1,645 26 $ 6,256 $ 4,151 143 4 570 8 3,575 1,788 1,788 27 $ 5,565 $ 3,718 131 2 400 8 3,180 1,590 1,590 28 $ 5,656 $ 4,174 146 3 458 8 3,232 1,616 1,616 29 $ 5,856 $ 3,966 147 3. 490 8 3,346 1,673 1,673 30 $ 6,406 $ 4,270 147 4 588 8 3,661 1,830 1,830 31 $ 4,855 $ 3,808 150 3. 300 8 2,774 1,387 1,387 32 $ 5,506 $ 4,347 150 3. 420 10 3,146 1,573 1,573 33 $ 5,656 $ 4,300 150 4 440 8 3,232 1,616 1,616 34 $ 5,681 $ 4,472 150 5 430 10 3,246 1,623 1,623 35 $ 5,731 $ 4,098 150 4 475 8 3,275 1,637 1,637 36 $ 6,006 $ 3,796 150 3. 500 8 3,432 1,716 1,716 37 $ 6,106 $ 3,904 150 4 515 8 3,489 1,745 1,745 38 $ 6,256 $ 4,552 150 4 480 8 3,575 1,788 1,788 39 $ 6,306 $ 4,457 150 4 540 10 3,604 1,802 1,802 40 $ 6,406 $ 4,684 150 4 490 8 3,661 1,830 1,830 41 $ 6,907 $ 4,281 1,500 4 650 8 3,947 1,973 1,973 42 $ 7,107 $ 4,404 150 4 670 8 4,061 2,031 2,031 43 $ 5,856 $ 4,424 154 4 450 8 3,346 1,673 1,673 44 $ 6,507 $ 4,586 120 4 320 10 3,718 1,859 1,859 45 $ 6,857 $ 4,651 169 5 580 10 3,918 1,959 1,959 46 $ 7,007 $ 4,976 169 3 700 8 4,004 2,002 2,002 47 $ 7,883 $ 4,983 169 5 680 10 4,505 2,252 2,252 48 $ 5,600 $ 4,785 173 4 600 10 32,000 1,600 1,600 49 $ 4,375 $ 5,120 173 5 720 8 2,500 1,250 1,250 50 $ 8,008 $ 5,127 173 4 600 100 4,576 2,288 2,288 51 $ 6,081 $ 4,609 180 3 450 10 3,475 1,737 1,737 52 $ 6,256 $ 4,742 188 4 460 10 3,575 1,788 1,788
Step by Step Solution
There are 3 Steps involved in it
To prepare a visual diagram of the relationship between total operating cost and a single cost driver we need to identify the best cost driver Lets ex... View full answer

Get step-by-step solutions from verified subject matter experts