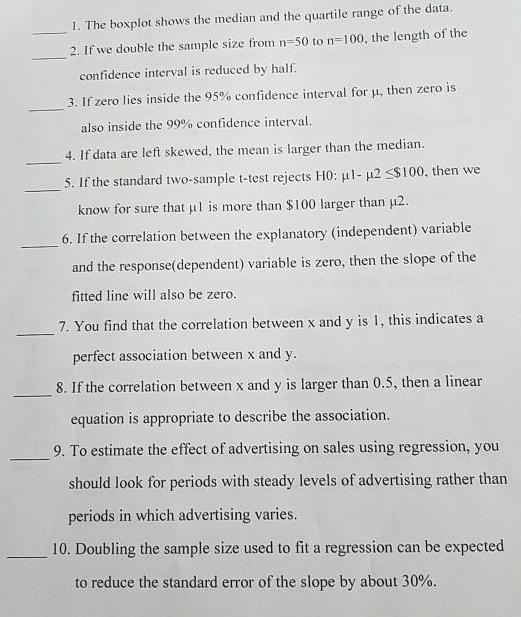
1. The boxplot shows the median and the quartile range of the data. 2. If we...
Fantastic news! We've Found the answer you've been seeking!
Question:
Transcribed Image Text:
1. The boxplot shows the median and the quartile range of the data. 2. If we double the sample size from n=50 to n=100, the length of the confidence interval is reduced by half. 3. If zero lies inside the 95% confidence interval for u, then zero is also inside the 99% confidence interval. 4. If data are lefi skewed, the mean is larger than the median. 5. If the standard two-sample t-test rejects H0: ul- p2 <$100, then we know for sure that ul is more than $100 larger than µ2. 6. If the correlation between the explanatory (independent) variable and the response(dependent) variable is zero, then the slope of the fitted line will also be zero. 7. You find that the correlation between x and y is 1, this indicates a perfect association between x and y. 8. If the correlation between x and y is larger than 0.5, then a linear equation is appropriate to describe the association. 9. To estimate the effect of advertising on sales using regression, you should look for periods with steady levels of advertising rather than periods in which advertising varies. 10. Doubling the sample size used to fit a regression can be expected to reduce the standard error of the slope by about 30%. 1. The boxplot shows the median and the quartile range of the data. 2. If we double the sample size from n=50 to n=100, the length of the confidence interval is reduced by half. 3. If zero lies inside the 95% confidence interval for u, then zero is also inside the 99% confidence interval. 4. If data are lefi skewed, the mean is larger than the median. 5. If the standard two-sample t-test rejects H0: ul- p2 <$100, then we know for sure that ul is more than $100 larger than µ2. 6. If the correlation between the explanatory (independent) variable and the response(dependent) variable is zero, then the slope of the fitted line will also be zero. 7. You find that the correlation between x and y is 1, this indicates a perfect association between x and y. 8. If the correlation between x and y is larger than 0.5, then a linear equation is appropriate to describe the association. 9. To estimate the effect of advertising on sales using regression, you should look for periods with steady levels of advertising rather than periods in which advertising varies. 10. Doubling the sample size used to fit a regression can be expected to reduce the standard error of the slope by about 30%.
Expert Answer:
Answer rating: 100% (QA)
Amswert OThe boxplat shows the mediam and the quamtile orange of the data TRUE 2 f we double the ... View the full answer
Related Book For
Posted Date:
Students also viewed these accounting questions
-
Confidence Interval for Sample of Size n 1 Based on the article An Effective Confidence Interval for the Mean with Samples of Size One and Two, by Wall, Boen, and Tweedie (American Statistician,...
-
Write a comparative analysis that assesses the pros and cons (i.e., benefits and costs) of post-COVID-19 related macroeconomic policies between the united kingdom and india using macroeconomic...
-
From Problem 13, we know that "a 95% confidence interval for the mean age of all U.S. millionaires is from 54.3 years to 62.8 years." Decide which of the following sentences provide a correct...
-
Suppose that the owner of the restaurant in Problem 2.91 also wants to study the demand for dessert during the same time period. She decides that in addition to studying whether a dessert was...
-
The article Cops Get Screened for Digital Dirt (USA Today, Nov. 12, 2010) summarizes a report on law enforcement agency use of social media to screen applicants for employment. The report was based...
-
Development of a new deluxe version of a particular software product is being considered. The activities necessary for the completion of this project are listed in the table below along with their...
-
Find the tip deflection of the cantilever beam shown in Fig. 12.22 when a vertical load of \(P=500 \mathrm{~N}\) is applied at point \(Q\) using (a) a one-element approximation and (b) a two-element...
-
On September 1, 2012, the account balances of Moore Equipment Repair were as During September, the following summary transactions were completed.Sept. 8 Paid $1,400 for salaries due employees, of...
-
How has the organization's approach to career progression, mentorship, and work-life balance influenced your decision to remain committed to your role ?
-
Imagine that you have extracted an unmyelinated neuron and have placed it in a sterile petri dish filled with a solution mimicking its natural extracellular envirnoment. you artificially stimulate...
-
United States Cyber Command uses state-of-the arttechnology. However, the fundamentals are as important as anyinnovative technology.Given that, what are the three basic local areanetwork (LAN)...
-
what is SQL injection and what are the different counter measures to prevent the attack?
-
Explain the methodology of calculation of HDI.
-
What do you understand by the term social media marketing? Illustrate with an example.
-
what is list and methods and explain its data types?
-
Discuss the simplex procedure for solving a linear programming problem Explain sensitivity analysis for a linear programming problem What is meant by optimum dual solution? State the algorithm for...
-
What is the benefit of the CASS system?
-
Revol Industries manufactures plastic bottles for the food industry. On average, Revol pays $76 per ton for its plastics. Revol's waste-disposal company has increased its waste-disposal charge to $57...
-
Listed below are the heights (inches) for the simple random sample of supermodels Lima, Bundchen, Ambrosio, Ebanks, Iman, Rubik, Kurkova, Kerr, Kroes, and Swanepoel. Use a 0.01 significance level to...
-
Refer to the table of pulse rates. Is there some meaningful way in which each male pulse rate is matched with the corresponding female pulse rate? If the male pulse rates and the female pulse rates...
-
If 25 people are randomly selected, find the probability that no 2 of them have the same birthday. Ignore leap years.
-
Show that having the exact value for the estimated sensor bandwidth is not required for the experimental process to find KEst discussed in Section 10. 4.3.4. In Experiment 10E, corrupt the value of...
-
Provide the modeling equations for the following figure. Assume an analog PI controller (GC(s)), a single-pole low-pass filter with a break frequency of 200 Hz for the feedback filter (H(s)), and a...
-
What is the gain and phase of a single-pole low-pass filter (a) at its bandwidth and (b) at 1/10 its bandwidth? (c) Repeat for a two-pole low-pass filter with = 0.7
Study smarter with the SolutionInn App