

1. The data below shows a group of people plotted by their height and age. Below...
Fantastic news! We've Found the answer you've been seeking!
Question:


Transcribed Image Text:
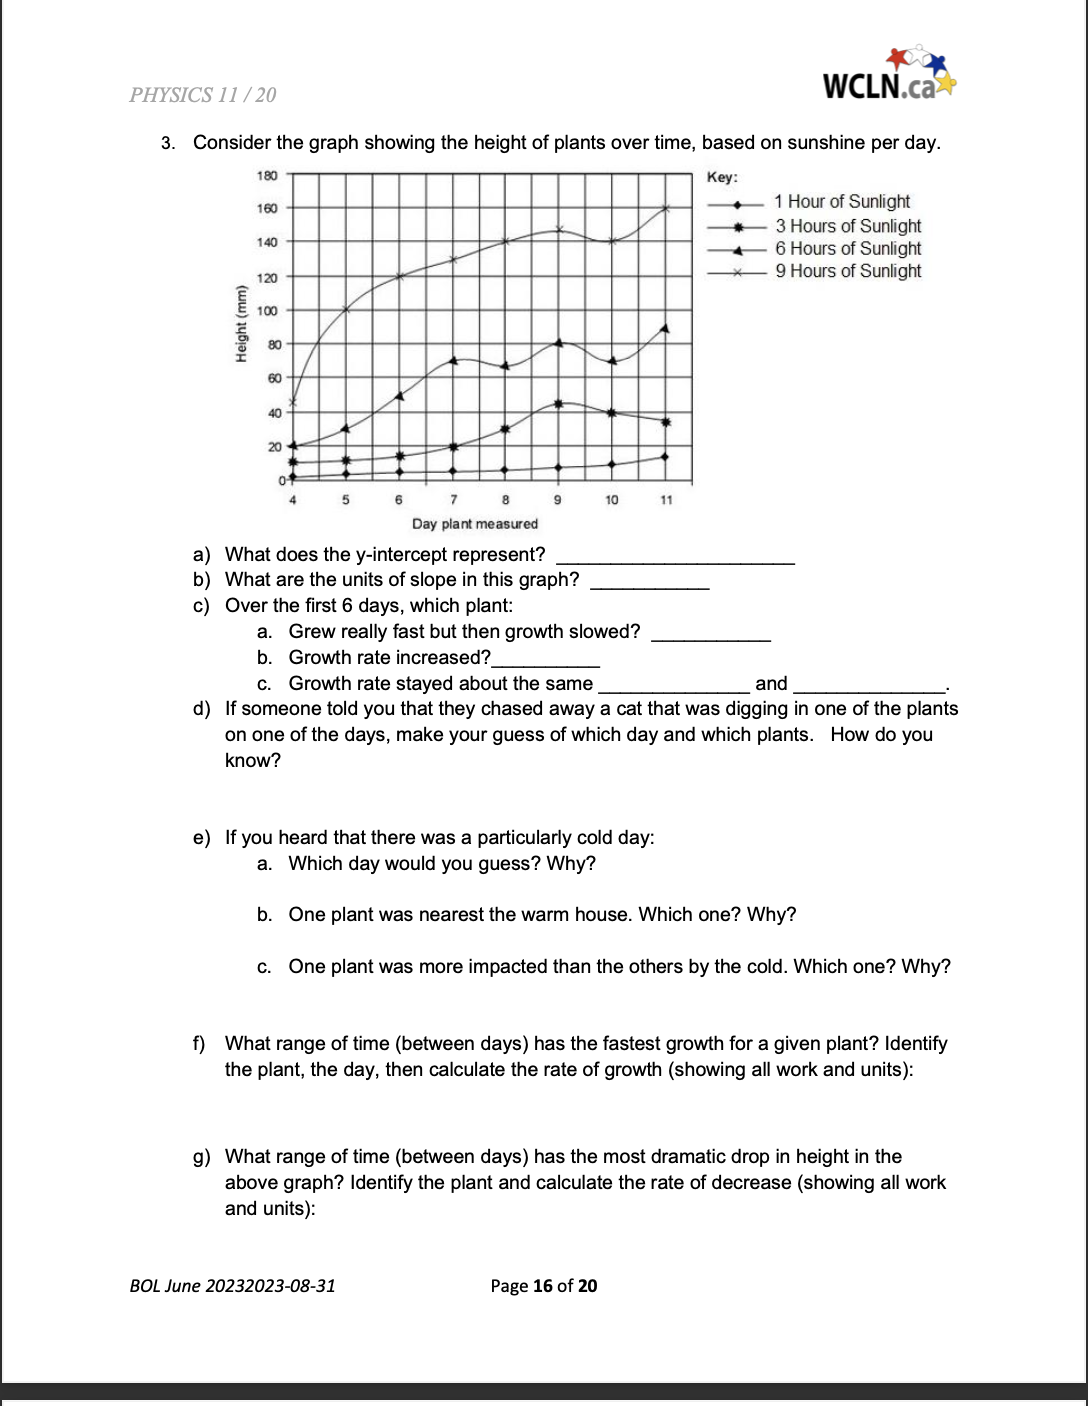
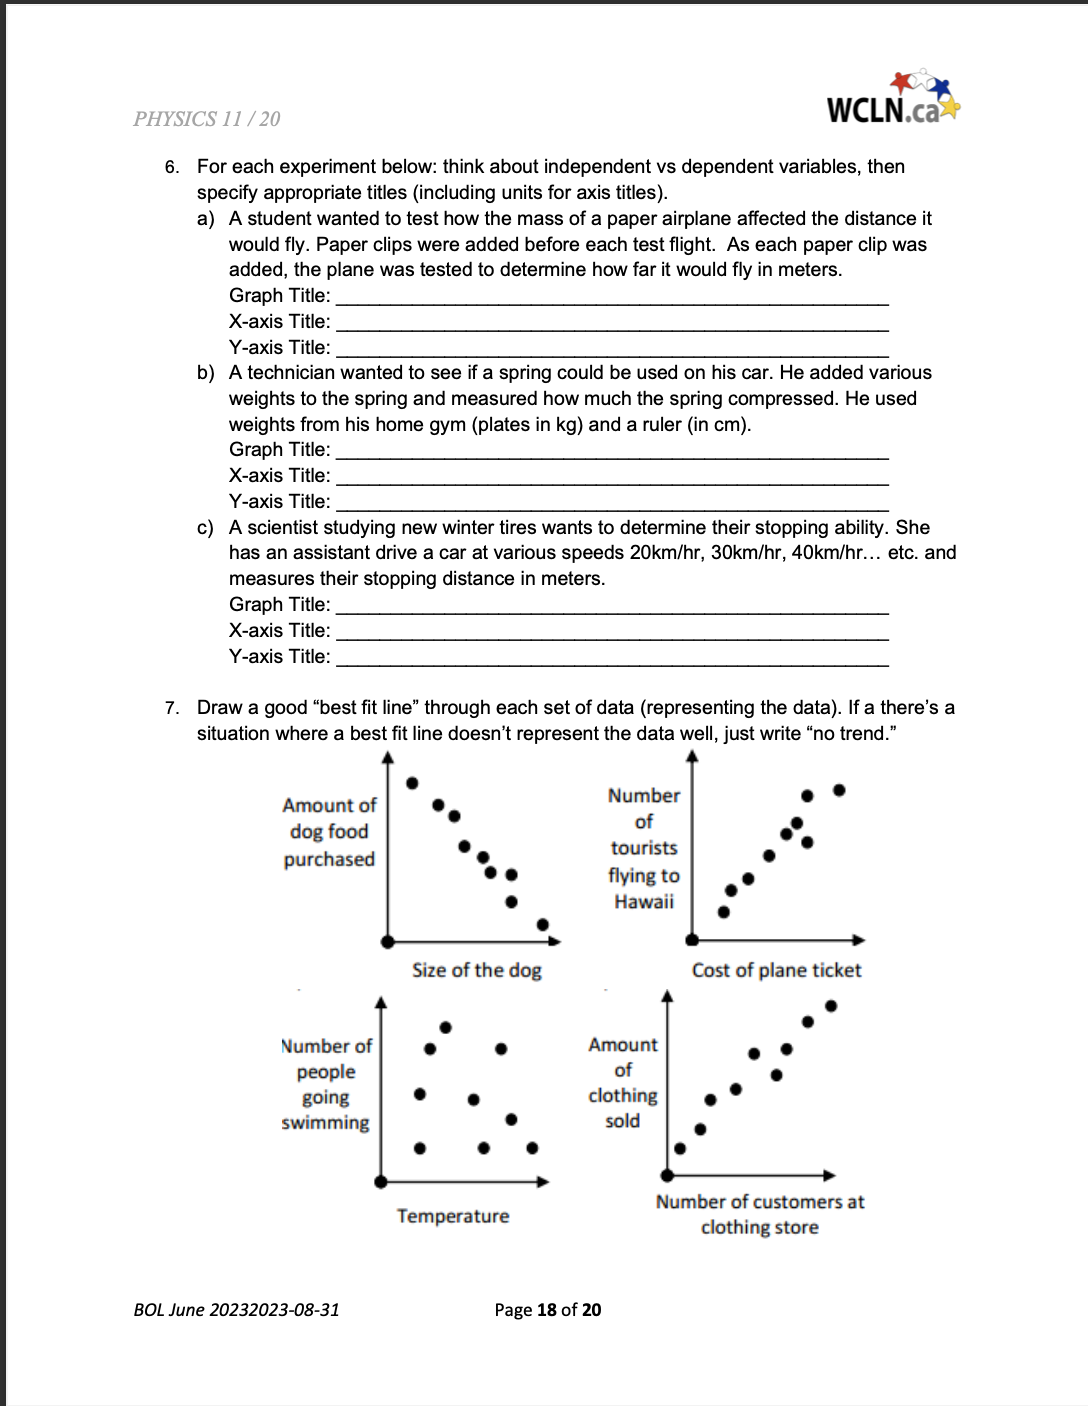
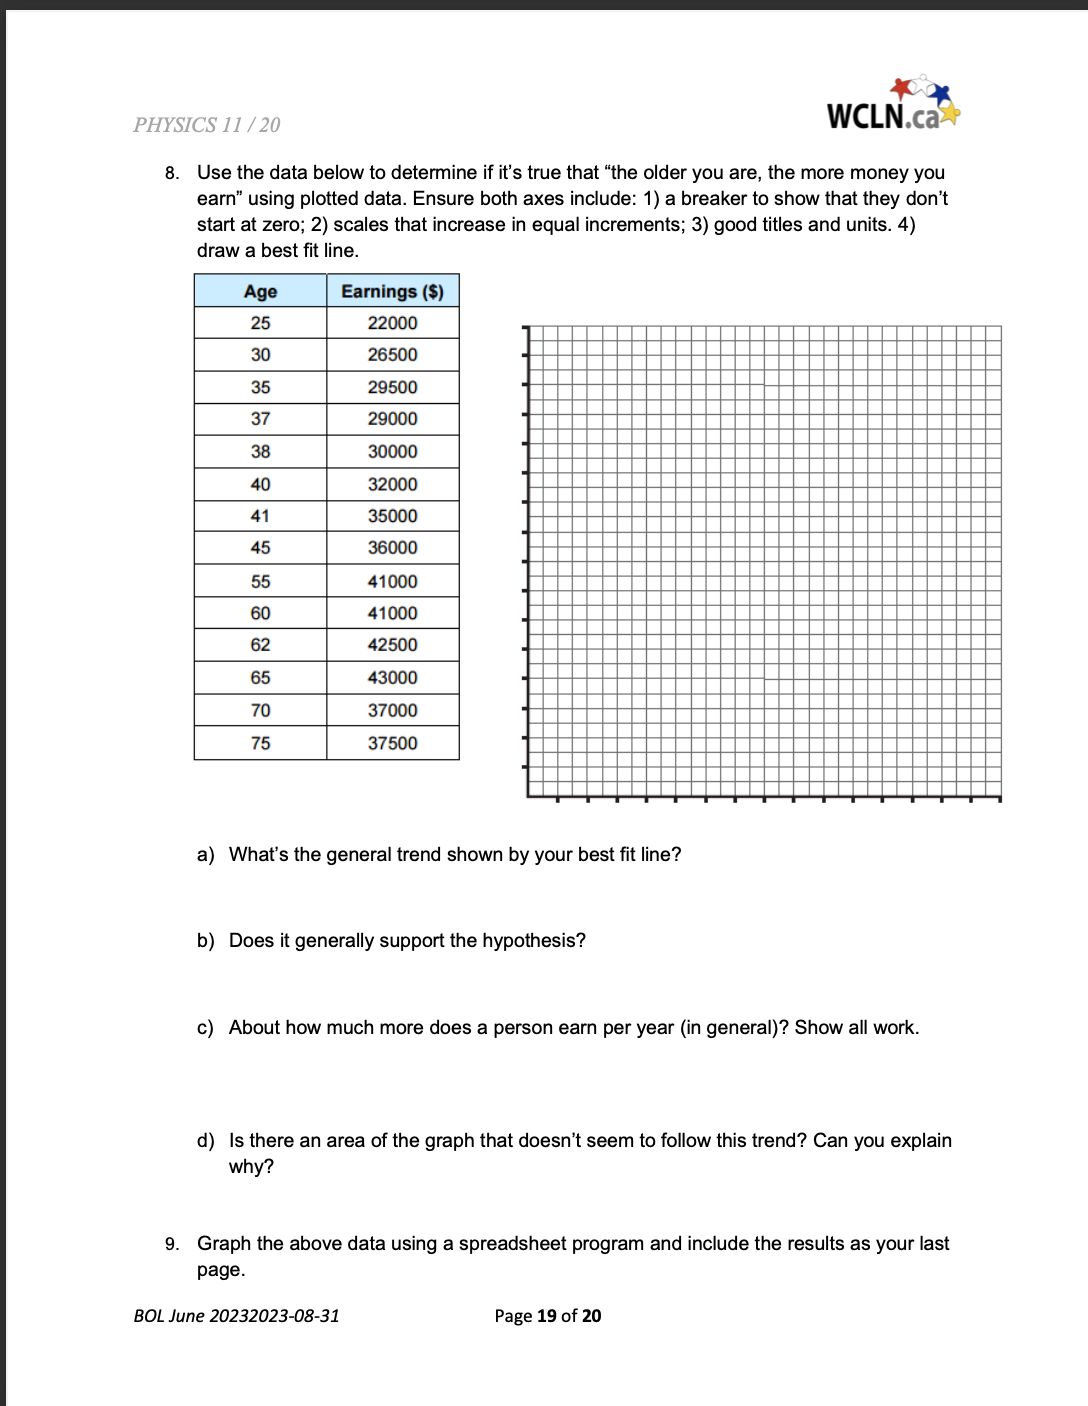
1. The data below shows a group of people plotted by their height and age. Below each person identify their dot on the graph. Please note that the person on the far right is carrying a baby. 2 AGE 7 HEIGHT 2. Consider the graph showing the population of a town called Newtown to answer the questions. POPULATION OF NEWTOWN: 1900-2000 Population 3,000 2,500 2,000 1,500 1,000 500 0 1900 1920 1940 1960 1980 2000 Year a) What year did the data on Newtown begin? b) What was the population when the data collection began? c) What was the population when the data collection stopped? d) When was the maximum population in Newton? e) What are the units of slope in this graph? f) What range of years has the greatest rate of increase in population in the above graph? Calculate the rate of increase (showing all work and units): g) What range of years has the slowest rate of increase in population in the above graph? Calculate the rate of increase (showing all work and units): h) What range of years has a decrease in population in the above graph? Calculate the rate of decrease (showing all work and units): PHYSICS 11/20 WCLN.ca 3. Consider the graph showing the height of plants over time, based on sunshine per day. 180 Key: 1 Hour of Sunlight Height (mm) 80 100 120 140 160 888 60 40 20 01 4 5 6 7 8 9 10 11 Day plant measured 3 Hours of Sunlight 6 Hours of Sunlight 9 Hours of Sunlight a) What does the y-intercept represent? b) What are the units of slope in this graph? c) Over the first 6 days, which plant: a. Grew really fast but then growth slowed? b. Growth rate increased? c. Growth rate stayed about the same and d) If someone told you that they chased away a cat that was digging in one of the plants on one of the days, make your guess of which day and which plants. How do you know? e) If you heard that there was a particularly cold day: a. Which day would you guess? Why? b. One plant was nearest the warm house. Which one? Why? c. One plant was more impacted than the others by the cold. Which one? Why? f) What range of time (between days) has the fastest growth for a given plant? Identify the plant, the day, then calculate the rate of growth (showing all work and units): g) What range of time (between days) has the most dramatic drop in height in the above graph? Identify the plant and calculate the rate of decrease (showing all work and units): BOL June 20232023-08-31 Page 16 of 20 PHYSICS 11/20 WCLN.ca 4. Suppose that the water level of a river is 34 meters and that it is receding at a rate of 0.50 meters per day. a) Write an equation for the water level, L, after d days. b) What does the slope in this relationship represent? c) Determine the number of days it would take to reach 26 meters (show all work): d) Sketch a graph of this situation for 10 days (include titles and units for everything) 5. A plumber charges $25 for a service call plus $50 per hour of service. a) Write an equation in slope-intercept form for the cost, C, after h hours of service b) What does the slope in this relationship represent? c) Determine the number of hours it would take to reach a cost of $500 (show all work): d) Sketch a graph of this situation for 10 hours (include titles and units for everything) BOL June 20232023-08-31 Page 17 of 20 PHYSICS 11/20 WCLN.ca 6. For each experiment below: think about independent vs dependent variables, then specify appropriate titles (including units for axis titles). a) A student wanted to test how the mass of a paper airplane affected the distance it would fly. Paper clips were added before each test flight. As each paper clip was added, the plane was tested to determine how far it would fly in meters. Graph Title: X-axis Title: Y-axis Title: b) A technician wanted to see if a spring could be used on his car. He added various weights to the spring and measured how much the spring compressed. He used weights from his home gym (plates in kg) and a ruler (in cm). Graph Title: X-axis Title: Y-axis Title: c) A scientist studying new winter tires wants to determine their stopping ability. She has an assistant drive a car at various speeds 20km/hr, 30km/hr, 40km/hr... etc. and measures their stopping distance in meters. Graph Title: X-axis Title: Y-axis Title: 7. Draw a good "best fit line" through each set of data (representing the data). If a there's a situation where a best fit line doesn't represent the data well, just write "no trend." Amount of dog food purchased Number of people going swimming BOL June 20232023-08-31 Size of the dog Temperature Number of tourists flying to Hawaii Amount of clothing sold Page 18 of 20 Cost of plane ticket Number of customers at clothing store PHYSICS 11/20 WCLN.ca 8. Use the data below to determine if it's true that "the older you are, the more money you earn" using plotted data. Ensure both axes include: 1) a breaker to show that they don't start at zero; 2) scales that increase in equal increments; 3) good titles and units. 4) draw a best fit line. Age Earnings ($) 25 22000 30 26500 35 29500 37 29000 38 30000 40 32000 41 35000 45 36000 55 41000 60 41000 62 42500 65 43000 70 37000 75 37500 a) What's the general trend shown by your best fit line? b) Does it generally support the hypothesis? c) About how much more does a person earn per year (in general)? Show all work. d) Is there an area of the graph that doesn't seem to follow this trend? Can you explain why? 9. Graph the above data using a spreadsheet program and include the results as your last page. BOL June 20232023-08-31 Page 19 of 20 1. The data below shows a group of people plotted by their height and age. Below each person identify their dot on the graph. Please note that the person on the far right is carrying a baby. 2 AGE 7 HEIGHT 2. Consider the graph showing the population of a town called Newtown to answer the questions. POPULATION OF NEWTOWN: 1900-2000 Population 3,000 2,500 2,000 1,500 1,000 500 0 1900 1920 1940 1960 1980 2000 Year a) What year did the data on Newtown begin? b) What was the population when the data collection began? c) What was the population when the data collection stopped? d) When was the maximum population in Newton? e) What are the units of slope in this graph? f) What range of years has the greatest rate of increase in population in the above graph? Calculate the rate of increase (showing all work and units): g) What range of years has the slowest rate of increase in population in the above graph? Calculate the rate of increase (showing all work and units): h) What range of years has a decrease in population in the above graph? Calculate the rate of decrease (showing all work and units): PHYSICS 11/20 WCLN.ca 3. Consider the graph showing the height of plants over time, based on sunshine per day. 180 Key: 1 Hour of Sunlight Height (mm) 80 100 120 140 160 888 60 40 20 01 4 5 6 7 8 9 10 11 Day plant measured 3 Hours of Sunlight 6 Hours of Sunlight 9 Hours of Sunlight a) What does the y-intercept represent? b) What are the units of slope in this graph? c) Over the first 6 days, which plant: a. Grew really fast but then growth slowed? b. Growth rate increased? c. Growth rate stayed about the same and d) If someone told you that they chased away a cat that was digging in one of the plants on one of the days, make your guess of which day and which plants. How do you know? e) If you heard that there was a particularly cold day: a. Which day would you guess? Why? b. One plant was nearest the warm house. Which one? Why? c. One plant was more impacted than the others by the cold. Which one? Why? f) What range of time (between days) has the fastest growth for a given plant? Identify the plant, the day, then calculate the rate of growth (showing all work and units): g) What range of time (between days) has the most dramatic drop in height in the above graph? Identify the plant and calculate the rate of decrease (showing all work and units): BOL June 20232023-08-31 Page 16 of 20 PHYSICS 11/20 WCLN.ca 4. Suppose that the water level of a river is 34 meters and that it is receding at a rate of 0.50 meters per day. a) Write an equation for the water level, L, after d days. b) What does the slope in this relationship represent? c) Determine the number of days it would take to reach 26 meters (show all work): d) Sketch a graph of this situation for 10 days (include titles and units for everything) 5. A plumber charges $25 for a service call plus $50 per hour of service. a) Write an equation in slope-intercept form for the cost, C, after h hours of service b) What does the slope in this relationship represent? c) Determine the number of hours it would take to reach a cost of $500 (show all work): d) Sketch a graph of this situation for 10 hours (include titles and units for everything) BOL June 20232023-08-31 Page 17 of 20 PHYSICS 11/20 WCLN.ca 6. For each experiment below: think about independent vs dependent variables, then specify appropriate titles (including units for axis titles). a) A student wanted to test how the mass of a paper airplane affected the distance it would fly. Paper clips were added before each test flight. As each paper clip was added, the plane was tested to determine how far it would fly in meters. Graph Title: X-axis Title: Y-axis Title: b) A technician wanted to see if a spring could be used on his car. He added various weights to the spring and measured how much the spring compressed. He used weights from his home gym (plates in kg) and a ruler (in cm). Graph Title: X-axis Title: Y-axis Title: c) A scientist studying new winter tires wants to determine their stopping ability. She has an assistant drive a car at various speeds 20km/hr, 30km/hr, 40km/hr... etc. and measures their stopping distance in meters. Graph Title: X-axis Title: Y-axis Title: 7. Draw a good "best fit line" through each set of data (representing the data). If a there's a situation where a best fit line doesn't represent the data well, just write "no trend." Amount of dog food purchased Number of people going swimming BOL June 20232023-08-31 Size of the dog Temperature Number of tourists flying to Hawaii Amount of clothing sold Page 18 of 20 Cost of plane ticket Number of customers at clothing store PHYSICS 11/20 WCLN.ca 8. Use the data below to determine if it's true that "the older you are, the more money you earn" using plotted data. Ensure both axes include: 1) a breaker to show that they don't start at zero; 2) scales that increase in equal increments; 3) good titles and units. 4) draw a best fit line. Age Earnings ($) 25 22000 30 26500 35 29500 37 29000 38 30000 40 32000 41 35000 45 36000 55 41000 60 41000 62 42500 65 43000 70 37000 75 37500 a) What's the general trend shown by your best fit line? b) Does it generally support the hypothesis? c) About how much more does a person earn per year (in general)? Show all work. d) Is there an area of the graph that doesn't seem to follow this trend? Can you explain why? 9. Graph the above data using a spreadsheet program and include the results as your last page. BOL June 20232023-08-31 Page 19 of 20
Expert Answer:

Related Book For 

Income Tax Fundamentals 2013
ISBN: 9781285586618
31st Edition
Authors: Gerald E. Whittenburg, Martha Altus Buller, Steven L Gill
Posted Date:
Students also viewed these physics questions
-
Planning is one of the most important management functions in any business. A front office managers first step in planning should involve determine the departments goals. Planning also includes...
-
The scatterplot and the model in Fig. 84 describe the association between the years and the winning times for the mens Olympic 100-meter run. Let y be the winning time (in seconds) for the mens...
-
In Problems 1968, solve each equation, if possible. -4 x + 4 || -3 x+6
-
Use these matrices to do the arithmetic problems 1a-d. If a particular operation is impossible, explain why? a. b. c. d. e. [D] [C] f. [A] [D] L42] LAl+[B] [3]=1 6 3 4 [c]=15 2 4.[D] -3 1 21 [D]=1 2...
-
In Europe, the average resident takes several weeks more of vacation time than in the United States. Per capita income, however, is higher in the United States than the European average. What can you...
-
A military jet traveling at \(1500 \mathrm{~m} / \mathrm{s}\) has engine trouble and the pilot must bail out. Her ejection seat shoots her forward at \(300 \mathrm{~m} / \mathrm{s}\) relative to the...
-
Describe two examples of specific DSSs that are being used to assist in decision making. You may use examples from the textbook or other examples you have read about or heard about.
-
Suppose there are two consumers, A and B. The utility functions of each consumer are given by: UA(X,Y) = X*Y UB(X,Y) = X*Y3 Therefore: For consumer A: MUX = Y; MUY = X For consumer B: MUX = Y3; MUY...
-
You are the CMO of Damen Ship Repair, a 300-year-old firm based in the Netherlands but with large facilities in major ports all over the world. Damen has just introduced a new service. For a fixed...
-
Let \(\left(B_{t}, \mathscr{F}_{t}ight)_{t \geqslant 0}\) be a \(\mathrm{BM}^{1}\). Show that \(X_{t}=\exp \left(a B_{t}+b tight), t \geqslant 0\), is a martingale if, and only if, \(a^{2} / 2+b=0\).
-
Let \(\left(B_{t}, \mathscr{F}_{t}ight)_{t \geqslant 0}\) be a one-dimensional Brownian motion and \(f \in \mathcal{C}^{1}(\mathbb{R})\). Show that \(M_{t}:=f(t) B_{t}-\int_{0}^{t} f^{\prime}(s)...
-
Go to wsj.com and click on Markets and Market Data Center. Under U.S. Stocks in the pull-down menu, click on Listed Options Quotes. Find the data on call and put options for Facebook. Find the calls...
-
In 2017, partial repeal of the Affordable Care Act was enacted by Congress as a part of a larger tax reform package that made many substantial changes to the tax code. Why does the manner in which it...
-
Break into small groups and create a bulleted list of what your team believes embodies professional excellence in communication. Compare your list with those of other groups in the class. Are there...
-
Sand Corporation manufactures two styles of lamps: a Bedford Lamp and a Lowell Lamp. The following per unit data are available: Total fixed costs are $40,000. Machine hour capacity is 30,000 hours...
-
Define a traverse in Surveying?
-
Write a program in \(\mathrm{R}\) that generates \(b\) samples of size \(n\) from a specified distribution \(F\). For each sample compute the statistic \(Z_{n}=n^{1 / 2}...
-
Write a program in \(\mathrm{R}\) that generates \(b\) samples of size \(n\) from a \(\mathbf{N}\left(\mathbf{0}, \boldsymbol{\Sigma}_{n}ight)\) distribution where...
-
Using a probability theory argument, show that the sum of all elements of any covariance matrix is non-negative.

Study smarter with the SolutionInn App