

Question: 1) The data in the following table were obtained during a colorimetric determination of glucose in blood serum. (a) Plot the data. Include proper labelling
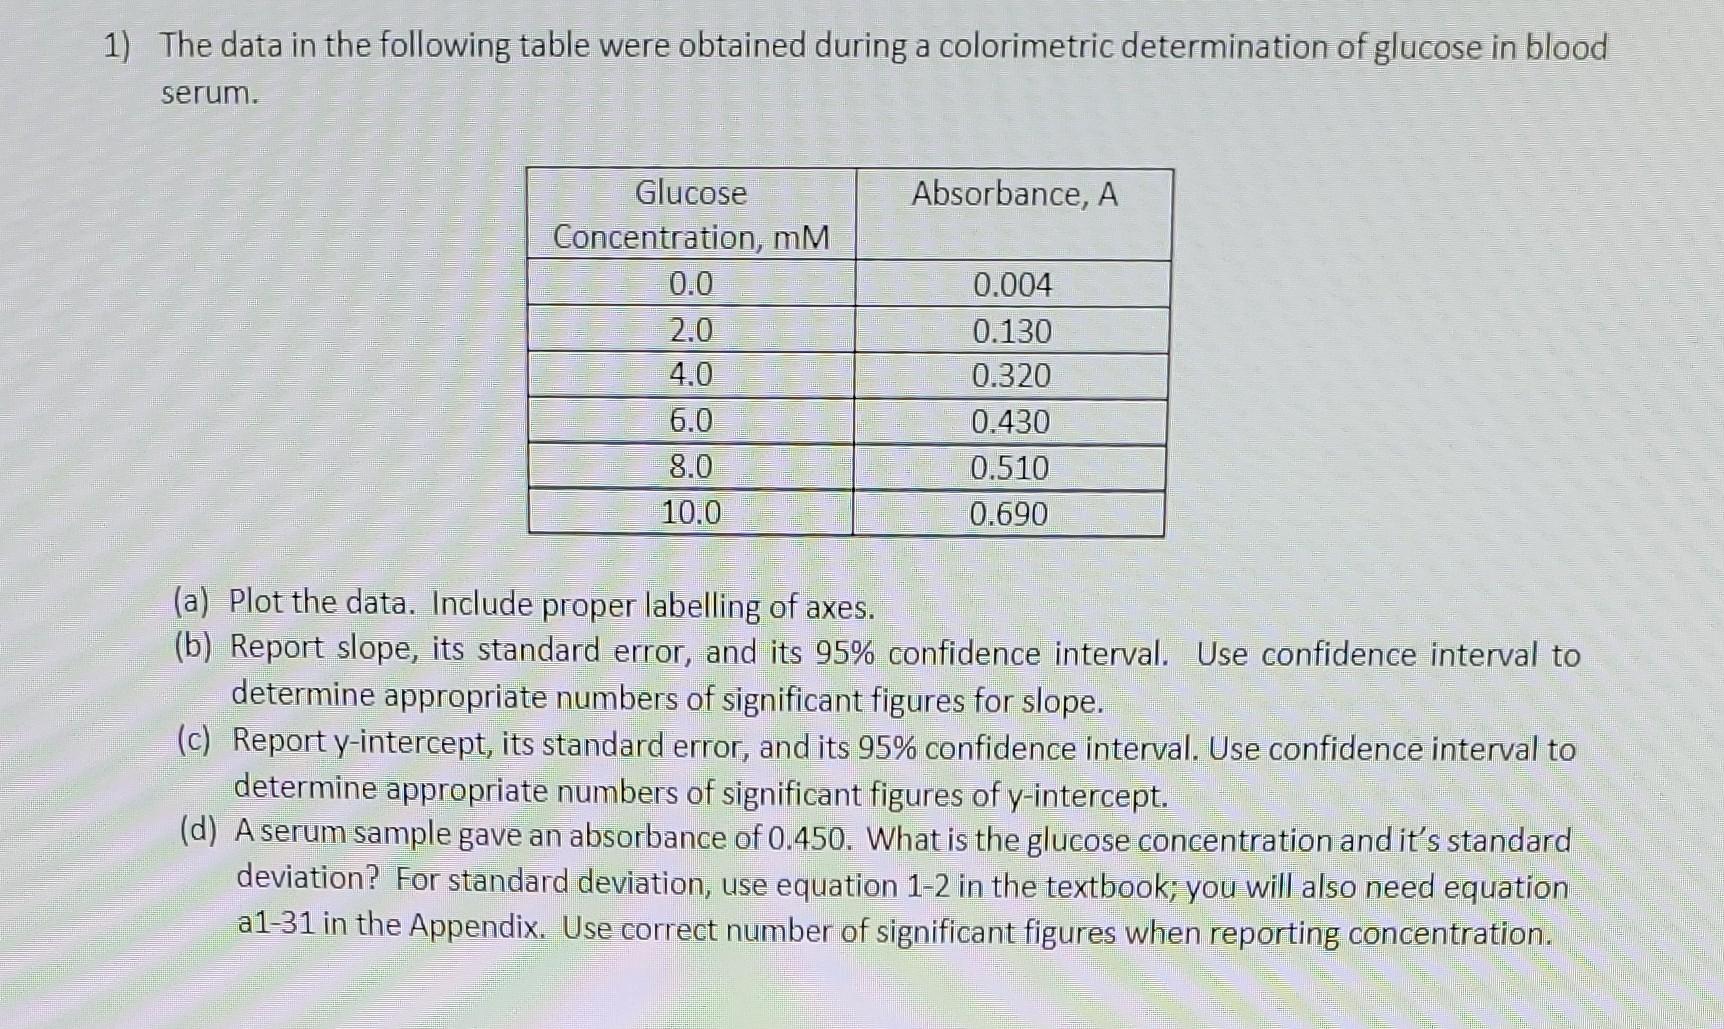
1) The data in the following table were obtained during a colorimetric determination of glucose in blood serum. (a) Plot the data. Include proper labelling of axes. (b) Report slope, its standard error, and its 95% confidence interval. Use confidence interval to determine appropriate numbers of significant figures for slope. (c) Report y-intercept, its standard error, and its 95\% confidence interval. Use confidence interval to determine appropriate numbers of significant figures of y-intercept. (d) A serum sample gave an absorbance of 0.450. What is the glucose concentration and it's standard deviation? For standard deviation, use equation 1-2 in the textbook; you will also need equation a1-31 in the Appendix. Use correct number of significant figures when reporting concentration
Step by Step Solution
There are 3 Steps involved in it

Get step-by-step solutions from verified subject matter experts