

Question: 4. The data in the following table were obtained from colorimetric determination of glucose in blood serum. Xylitol was added as an internal standard. Calculate
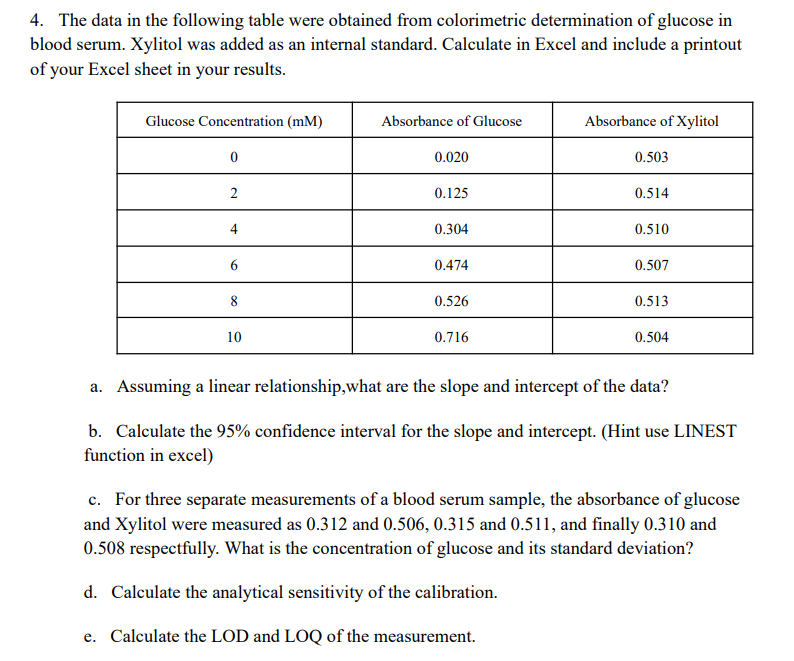
4. The data in the following table were obtained from colorimetric determination of glucose in blood serum. Xylitol was added as an internal standard. Calculate in Excel and include a printout of your Excel sheet in your results. Glucose Concentration (MM) Absorbance of Glucose Absorbance of Xylitol 0 0.020 0.503 2 0.125 0.514 4 0.304 0.510 6 0.474 0.507 8 0.526 0.513 10 0.716 0.504 a. Assuming a linear relationship, what are the slope and intercept of the data? b. Calculate the 95% confidence interval for the slope and intercept. (Hint use LINEST function in excel) c. For three separate measurements of a blood serum sample, the absorbance of glucose and Xylitol were measured as 0.312 and 0.506, 0.315 and 0.511, and finally 0.310 and 0.508 respectfully. What is the concentration of glucose and its standard deviation? d. Calculate the analytical sensitivity of the calibration. e. Calculate the LOD and LOQ of the measurement
Step by Step Solution
There are 3 Steps involved in it

Get step-by-step solutions from verified subject matter experts