

Question: 1. The data shown in Table 1, taken from Wakefield et al. (1994), were collected following the admin- istration of a single 30mg dose of
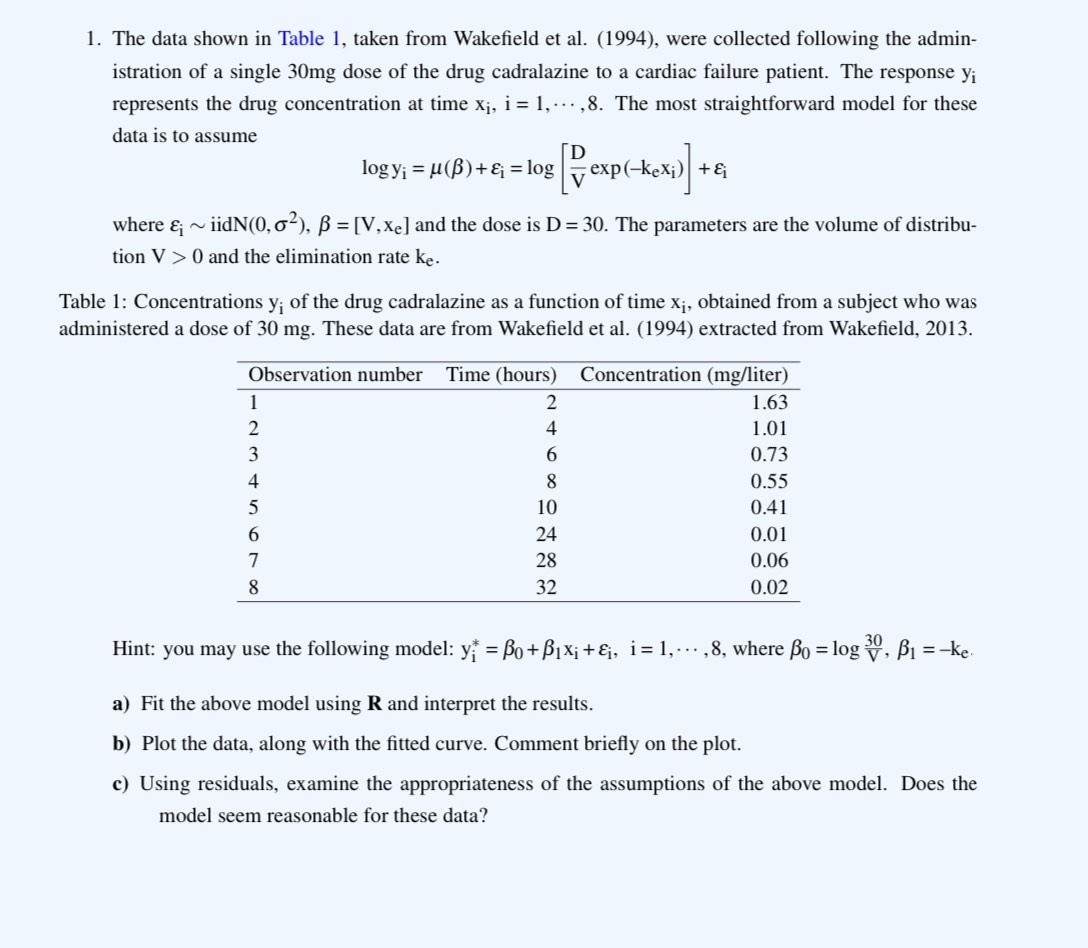
1. The data shown in Table 1, taken from Wakefield et al. (1994), were collected following the admin- istration of a single 30mg dose of the drug cadralazine to a cardiac failure patient. The response y; represents the drug concentration at time xi, i = 1, ...,8. The most straightforward model for these data is to assume logy; = u(B) + = = log v exp(-kexi) + & where &; ~ iidN(0, 62), B =[V,Xe] and the dose is D = 30. The parameters are the volume of distribu- tion V > 0 and the elimination rate ke. Table 1: Concentrations y; of the drug cadralazine as a function of time x;, obtained from a subject who was administered a dose of 30 mg. These data are from Wakefield et al. (1994) extracted from Wakefield, 2013. Observation number Time (hours) Concentration (mg/liter) 1.63 1.01 00 O A N 0.73 0.55 DO NOVIAWN- 10 0.41 24 0.01 28 0.06 32 0.02 Hint: you may use the following model: yf = Bo + Bixi+&, i= 1, ...,8, where Bo = log Y, B1 =-ke. a) Fit the above model using R and interpret the results. b) Plot the data, along with the fitted curve. Comment briefly on the plot. c) Using residuals, examine the appropriateness of the assumptions of the above model. Does the model seem reasonable for these data
Step by Step Solution
There are 3 Steps involved in it

Get step-by-step solutions from verified subject matter experts