

Question: 1. The data table to the right is the position vs. time for an object in free fall, taken by last year's physics class. The
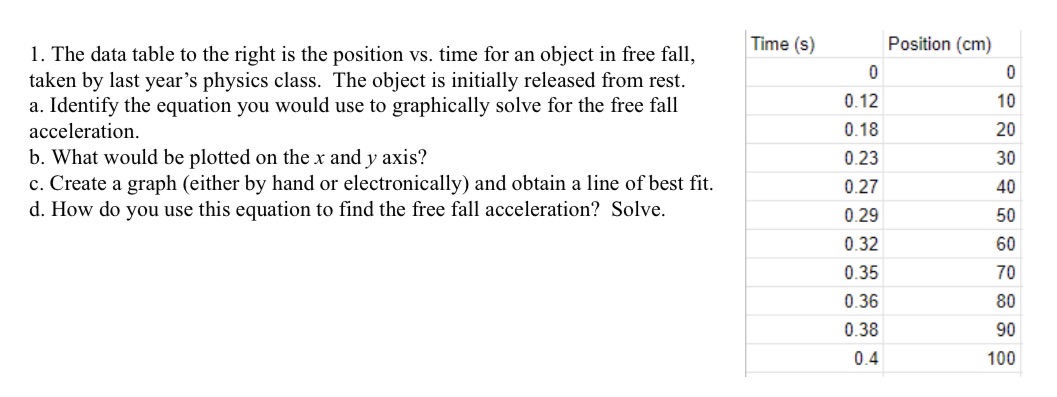
1. The data table to the right is the position vs. time for an object in free fall, taken by last year's physics class. The object is initially released from rest. a. Identify the equation you would use to graphically solve for the free fall acceleration. b. What would be plotted on the x and y axis? 0. Create a graph (either by hand or electronically) and obtain a line of best t. d. How do you use this equation to nd the free fall acceleration? Solve. Time (s) I] 0.12 0.13 0 23 0.2? 0 29 0.32 0.35 0 35 0.33 0 4 Position (cm) 0 10 20 30 40 SCI 60 70 80 90 100
Step by Step Solution
There are 3 Steps involved in it
1 Expert Approved Answer
Step: 1 Unlock

Question Has Been Solved by an Expert!
Get step-by-step solutions from verified subject matter experts
Step: 2 Unlock
Step: 3 Unlock