

Question: 1. The exercise disk for this chapter contains monthly data for stock prices of Kellogg and IBM. Compute the return statistics and graph a frontier
1. The exercise disk for this chapter contains monthly data for stock prices of Kellogg and
IBM. Compute the return statistics and graph a frontier of combinations of the two stocks.
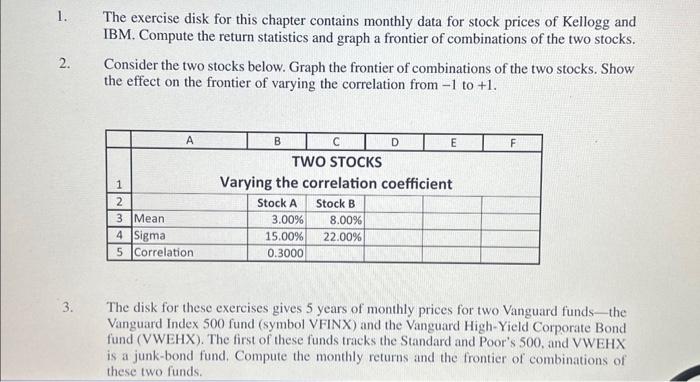
1. The exercise disk for this chapter contains monthly data for stock prices of Kellogg and IBM. Compute the return statistics and graph a frontier of combinations of the two stocks. 2. Consider the two stocks below. Graph the frontier of combinations of the two stocks. Show the effect on the frontier of varying the correlation from -1 to +1 . 3. The disk for these exercises gives 5 years of monthly prices for two Vanguard funds - the Vanguard Index 500 fund (symbol VFINX) and the Vanguard High-Yield Corporate Bond fund (VWEHX). The first of these funds tracks the Standard and Poor's 500, and VWEHX is a junk-bond fund, Compute the monthly returns and the frontier of combinations of these two funds. 1. The exercise disk for this chapter contains monthly data for stock prices of Kellogg and IBM. Compute the return statistics and graph a frontier of combinations of the two stocks. 2. Consider the two stocks below. Graph the frontier of combinations of the two stocks. Show the effect on the frontier of varying the correlation from -1 to +1 . 3. The disk for these exercises gives 5 years of monthly prices for two Vanguard funds - the Vanguard Index 500 fund (symbol VFINX) and the Vanguard High-Yield Corporate Bond fund (VWEHX). The first of these funds tracks the Standard and Poor's 500, and VWEHX is a junk-bond fund, Compute the monthly returns and the frontier of combinations of these two funds
Step by Step Solution
There are 3 Steps involved in it

Get step-by-step solutions from verified subject matter experts