

Question: The exercise disk for this chapter contains monthly data for stock prices for kellogg and IBM. Compute the return statistics and graph a frontier of
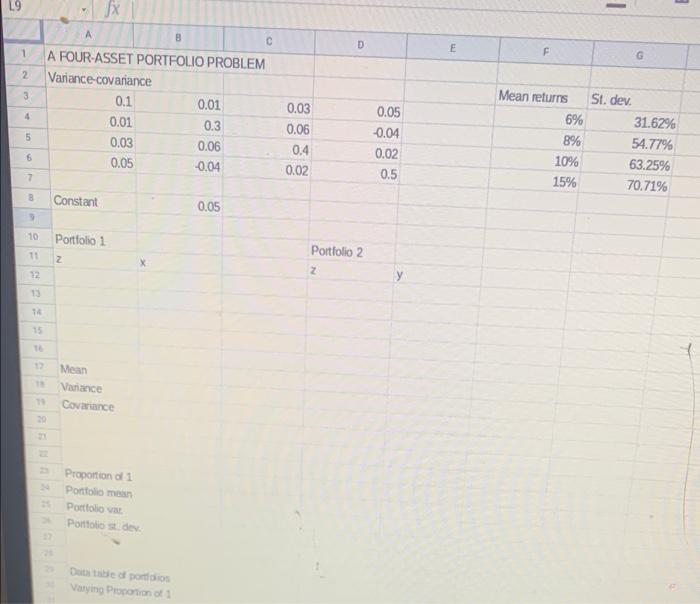
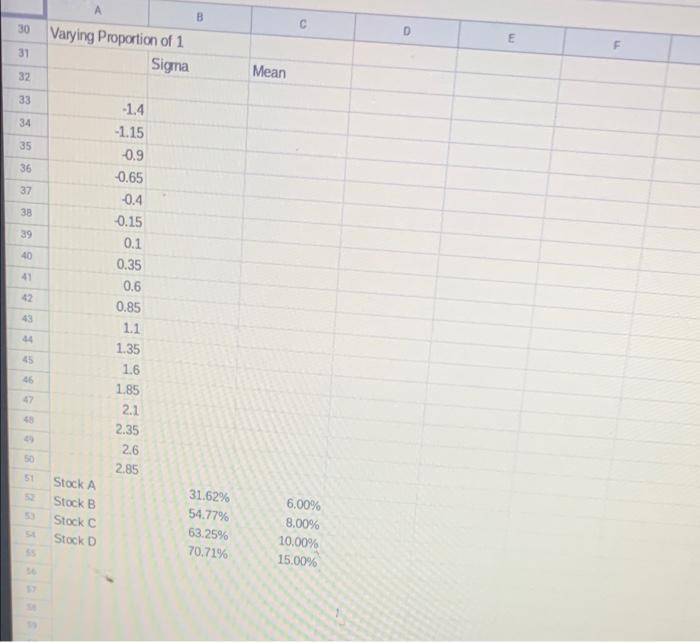
3 L9 X B D E 1 F G 2 3 A FOUR-ASSET PORTFOLIO PROBLEM Variance covariance 0.1 0.01 0.01 0.3 0.03 0.06 0.05 -0.04 4 0.05 5 0.03 0.06 0.4 0.02 Mean returns 6% 8% 10% 15% -0.04 0.02 0.5 St. der 31.62% 54.77% 63.25% 70.71% 6 7 B Constant 0.05 10 Portfolio 1 11 z Portfolio 2 z 12 13 14 15 TE 1 13 Mean Vanance Covariance Proportion 1 Portfolio mean Portfolio Portfolio sto Dabeo por Vary Proportion 30 B Varying Proportion of 1 Sigma E 31 Mean 32 33 34 35 -1.4 -1.15 -0.9 0.65 36 37 -0.4 38 39 40 41 42 -0.15 0.1 0.35 0.6 0.85 1.1 1.35 1.6 1.85 43 45 46 47 2.1 2.35 2.6 50 2.85 5 5 Stock A Stock B Stock C Stock D 5 31.62% 54.77% 63.25% 70.71% 6.00% 8.00% 10.00% 15.00% 3 L9 X B D E 1 F G 2 3 A FOUR-ASSET PORTFOLIO PROBLEM Variance covariance 0.1 0.01 0.01 0.3 0.03 0.06 0.05 -0.04 4 0.05 5 0.03 0.06 0.4 0.02 Mean returns 6% 8% 10% 15% -0.04 0.02 0.5 St. der 31.62% 54.77% 63.25% 70.71% 6 7 B Constant 0.05 10 Portfolio 1 11 z Portfolio 2 z 12 13 14 15 TE 1 13 Mean Vanance Covariance Proportion 1 Portfolio mean Portfolio Portfolio sto Dabeo por Vary Proportion 30 B Varying Proportion of 1 Sigma E 31 Mean 32 33 34 35 -1.4 -1.15 -0.9 0.65 36 37 -0.4 38 39 40 41 42 -0.15 0.1 0.35 0.6 0.85 1.1 1.35 1.6 1.85 43 45 46 47 2.1 2.35 2.6 50 2.85 5 5 Stock A Stock B Stock C Stock D 5 31.62% 54.77% 63.25% 70.71% 6.00% 8.00% 10.00% 15.00%
Step by Step Solution
There are 3 Steps involved in it

Get step-by-step solutions from verified subject matter experts