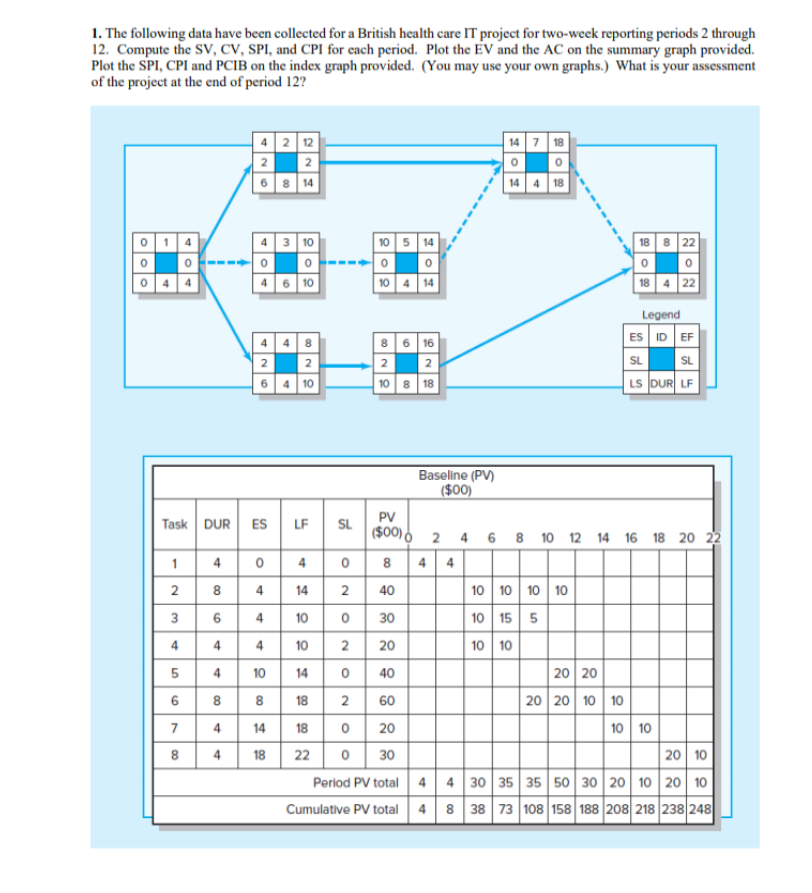
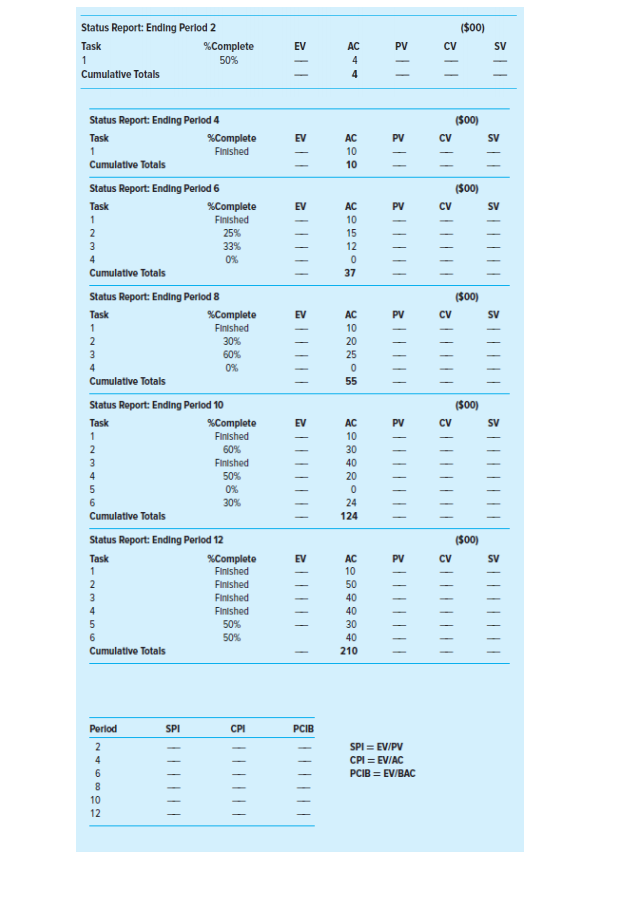
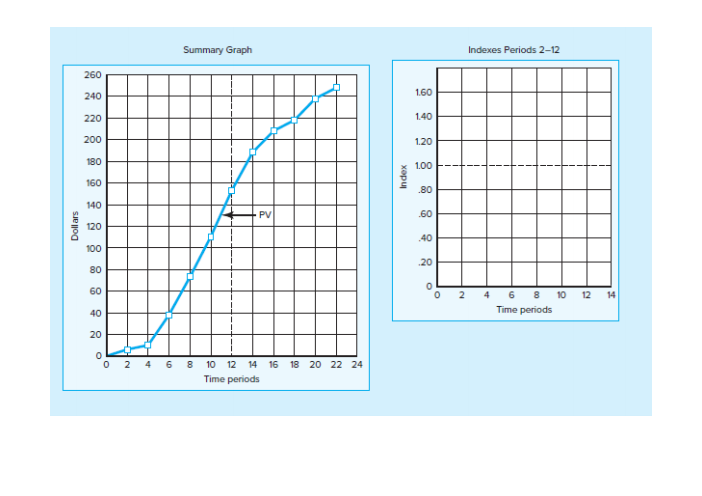
Question: 1. The following data have been collected for a British health care IT project for two-week reporting periods 2 through 12. Compute the Sv, CV,

1. The following data have been collected for a1. The following data have been collected for a1. The following data have been collected for a

1. The following data have been collected for a British health care IT project for two-week reporting periods 2 through 12. Compute the Sv, CV, SPI, and CPI for each period. Plot the EV and the AC on the summary graph provided. Plot the SPI, CPI and PCIB on the index graph provided. (You may use your own graphs.) What is your assessment of the project at the end of period 12? 4212 22 6 8 14 147 18 O O 144 18 1 0 4 3 10 0 0 4 6 10 10 5 14 0 0 10 4 14 18 8 22 0 0 18 4 22 Legend ESID EF SL SL LS OUR LF 8 6 16 22 108 18 22 6 4 10 ES 1 4 4 8 3 Baseline (PV) ($00) PV Task DUR LF SL ($00) 6 2 4 6 8 10 12 14 16 18 20 22 0 08 44 2 4 14 2 40 10 10 10 10 6 4 10 0 30 10 15 5 4 4 10 2 10 10 10 14 0 40 |20|20 818 2 60 |20|20| 10 | 10 | 7 4 14 14 180 20 10 10 8 4 18 22 030 | 2010 Period PV total 4 4 30 35 35 50 30 20 10 20 10 Cumulative PV total 4 8 38 73 108 158 188 208 218 238 248 4 20 5 4 6 8 ($00) CV EV Status Report: Ending Period 2 Task %Complete 50% Cumulative Totals PV SV 1 AC 4 4 (500) CV EV PV SV AC 10 10 (500) CV EV PV SV AC 10 15 12 0 37 ($00) EV PV CV SV Status Report: Ending Period 4 Task %Complete 1 Finished Cumulative Totals Status Report: Ending Period 6 Task %Complete 1 Finished 2 25% 33% 4 0% Cumulative Totals Status Report: Ending Period 8 Task %Complete 1 Finished 2 30% 3 60% 4 0% Cumulative Totals Status Report: Ending Perlod 10 Task %Complete 1 Finished 2 60% Finished 50% 5 0% 6 30% Cumulative Totals Status Report: Ending Period 12 Task %Complete 1 Finished 2 Finished 3 Finished Finished 50% 6 50% Cumulative Totals 10 20 25 0 55 11 ($00) CV EV PV SV 3 4 AC 10 30 40 20 0 24 124 (500) EV PV CV sv 10 50 40 40 30 40 210 Period SPI CPI PCIB 2 4 6 8 10 12 SPI = EV/PV CPI = EVIAC PCIB = EV/BAC Summary Graph Indexes Periods 2-12 260 240 1.60 220 1.40 200 1.20 180 1.00 Index 160 .80 140 PV .60 Dollars 120 .40 100 20 80 0 60 o 2 4 6 8 10 12 14 Time periods 40 20 0 0 2 16 18 20 22 24 4 6 8 10 12 14 Time periods

Step by Step Solution

There are 3 Steps involved in it

1 Expert Approved Answer
Step: 1 Unlock blur-text-image
Question Has Been Solved by an Expert!

Get step-by-step solutions from verified subject matter experts

Step: 2 Unlock
Step: 3 Unlock

Students Have Also Explored These Related General Management Questions!