

Question: this is a project management question, please help! i am very confused. these formulas may be needed the information states: EX13-7 (Algo) The following data
this is a project management question, please help! i am very confused. these formulas may be needed 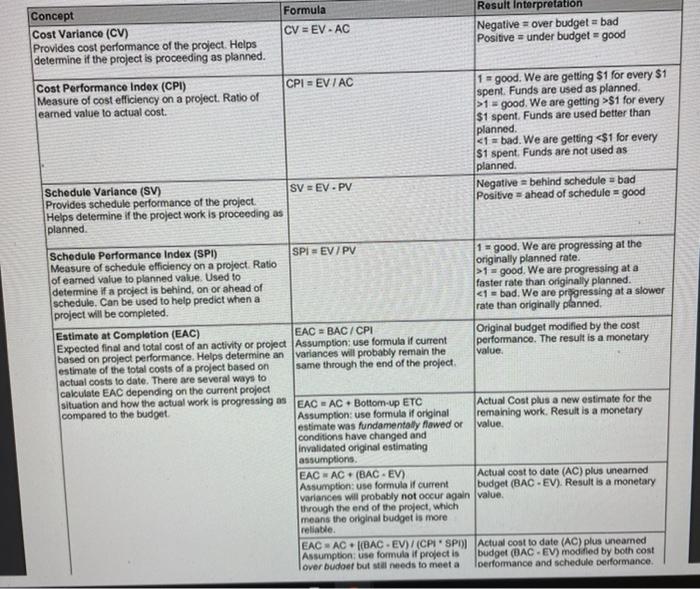
the information states: 
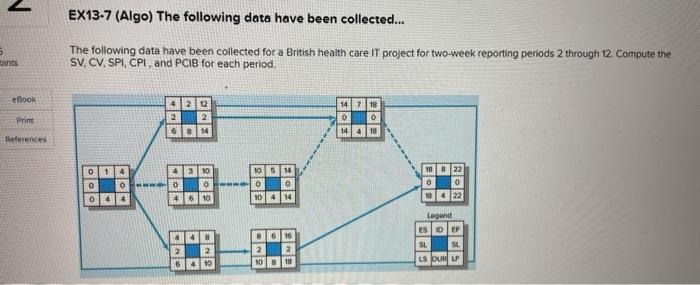
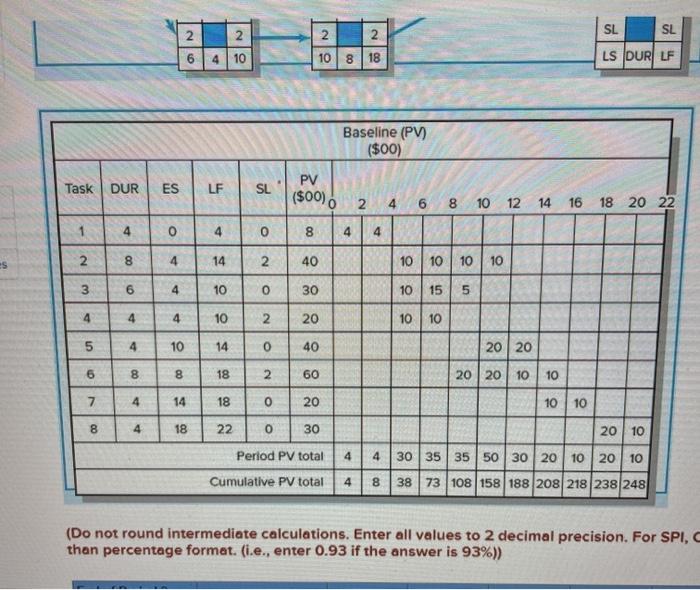
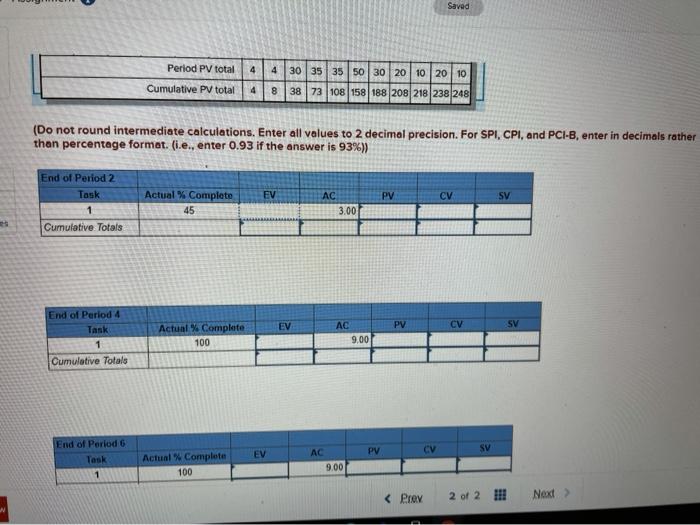
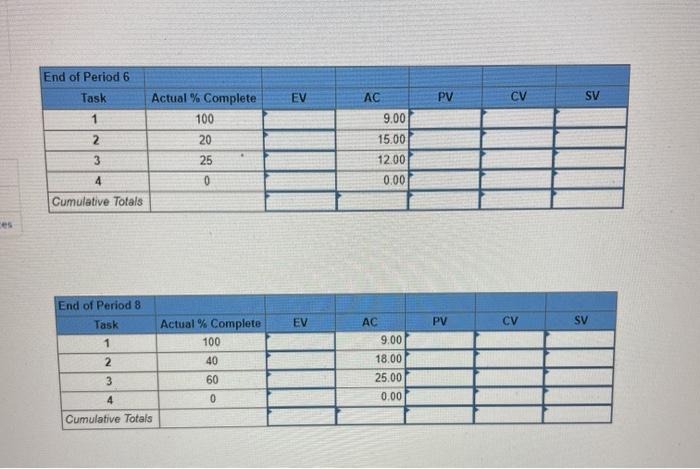
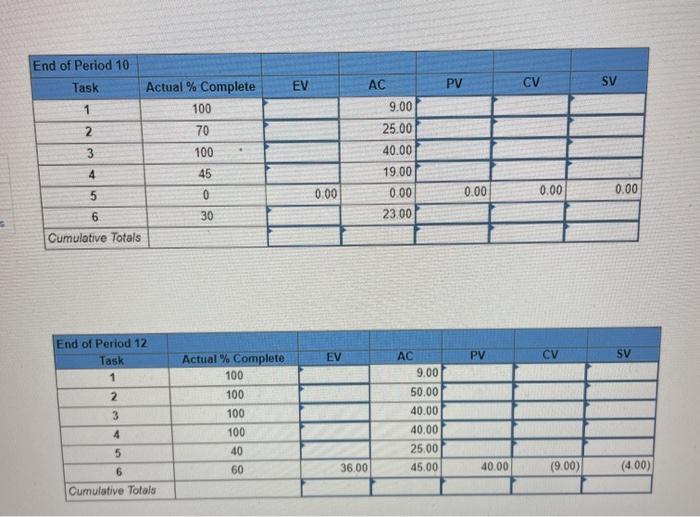
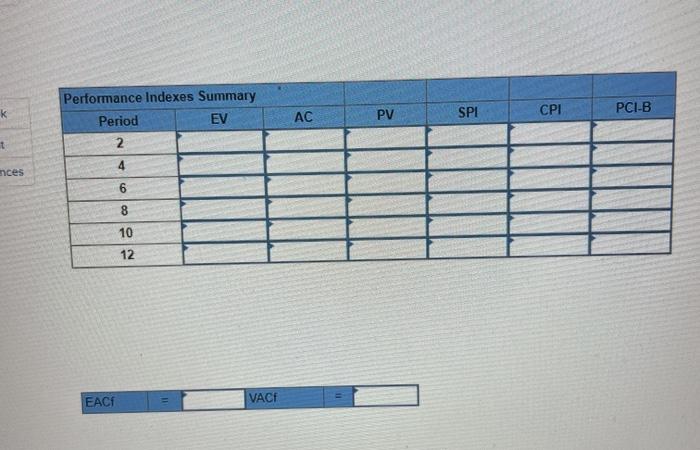
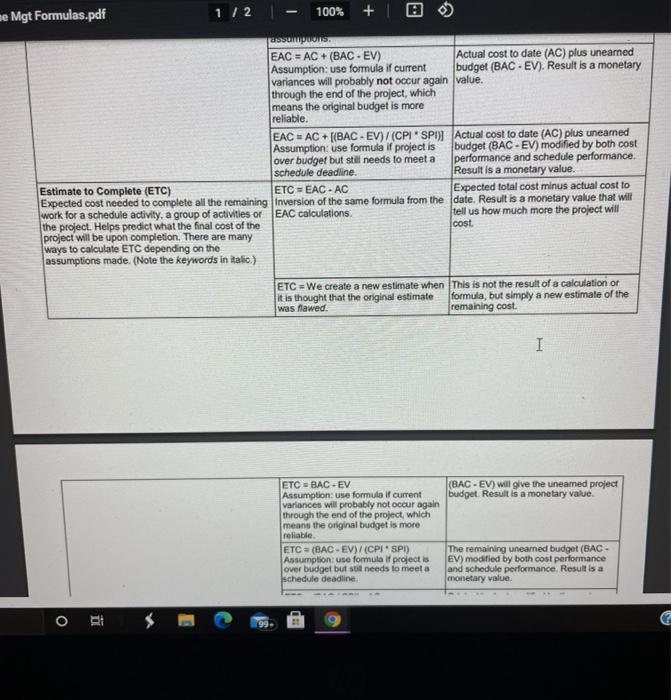
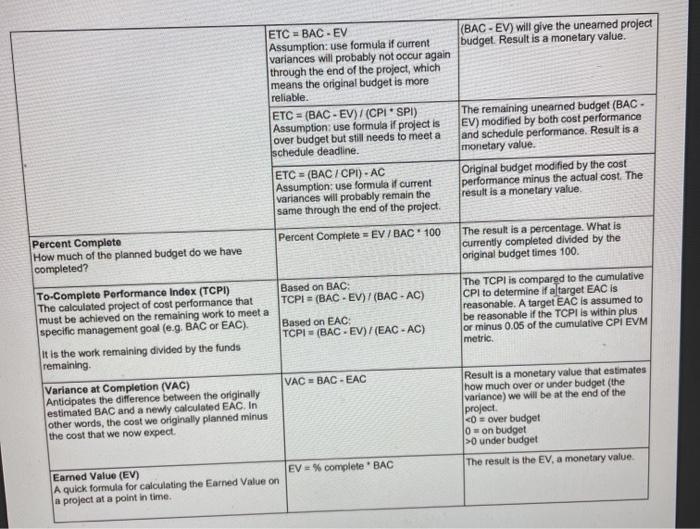
EX13-7 (Algo) The following data have been collected... The following data have been collected for a British health care IT project for two-week reporting periods 2 through 12. Compute the SV.CV, SPI, CPI and PCIB for each period. oints eBook Print 22 14 14718 0 0 14 418 References 0 0 o 044 4310 0 0 10 105.14 0 O 10414 18822 0 0 22 Legend ES EF SL ST 122 Oto 2 2 10 818 LS DURU 2. SL SL 22 10 8 18 6410 LS DUR LF Baseline (PV) ($00) PV Task DUR ES LF SL (500) N 4 6 8 10 12 14 16 18 20 22 4 4 8 4 4 2 4 14 40 10 10 10 10 3 4 10 30 10 15 5 4 0000 4 10 ONONONO 20 10 10 5 10 14 40 2020 6 8 18 60 2020 10 10 7 4 14 18 20 10 10 8 4 18 22 0 30 Period PV total Cumulative PV total 2010 4 4 30 35 35 50 30 20 10 20 10 48 38 73 108 158 188 208218238 248 (Do not round intermediate calculations. Enter all values to 2 decimal precision. For SPI, than percentage format. (i.e., enter 0.93 if the answer is 93%)) Saved Period PV total 4 4 30 35 35 50 30 20 10 20 10 8 3873 108158188208218238248 Cumulative PV total 4 (Do not round intermediate calculations. Enter all values to 2 decimal precision. For SPI, CPI, and PCI-B, enter in decimals rather than percentage format (.e., enter 0.93 if the answer is 93%) FV AC PV CV SV End of Period 2 Task 1 Cumulative Totals Actual % Complete 45 3.00 EV PV CV SV End of Period 4 Tank 1 Cumulative Totals Actual % Complete 100 AC 9.00 EV PV SV CV End of Period 6 Task 1 Actual Complete 100 AC 9.00 EV PV CV SV End of Period 6 Task 1 2 3 Actual % Complete 100 20 25 0 AC 9.00 15.00 12.00 0.00 4 Cumulative Totals End of Period 8 EV PV SV Task 1 2 Actual % Complete 100 40 AC 9.00 18.00 25.00 0.00 3 60 4 0 Cumulative Totals End of Period 10 Task 1 EV AC PV CV SV 2 Actual % Complete 100 70 100 45 3 9.00 25.00 40.00 19.00 0.00 23.00 4 5 0 0.00 0.00 0.00 0.00 30 Cumulative Totals EV PV CV End of Period 12 Task 1 SV 2 Actual % Complete 100 100 100 100 3 4 5 6 Cumulative Totals AC 9.00 50.00 40.00 40.00 25.00 45.00 40 60 36.00 40.00 (9.00) (4.00) PV CPI SPI Performance Indexes Summary Period EV 2 PCI-B t 4 nces 6 8 10 12 EAC VACE Formula CV = EV - AC Concept Cost Variance (CV) Provides cost performance of the project. Helps determine if the project is proceeding as planned. Result Interpretation Negative = over budget = bad Positive = under budget = good CPI = EV I AC Cost Performance Index (CPI) Measure of cost efficiency on a project. Ratio of earned value to actual cost. 1 good. We are getting $1 for every $1 spent Funds are used as planned, >1 good. We are getting >$1 for every $1 spent. Funds are used better than planned. 1 good. We are progressing at a determine if a project is behind, on or ahead of faster rate than originally planned. schedule. Can be used to help predict when a under budget The result is the EV. a monetary value EV % complete BAC Earned Value (EV) A quick formula for calculating the Earned Value on a project at a point in time. EX13-7 (Algo) The following data have been collected... The following data have been collected for a British health care IT project for two-week reporting periods 2 through 12. Compute the SV. CV, SPI, CPI, and PCIB for each period. onts Step by Step Solution
There are 3 Steps involved in it
1 Expert Approved Answer
Step: 1 Unlock

Question Has Been Solved by an Expert!
Get step-by-step solutions from verified subject matter experts
Step: 2 Unlock
Step: 3 Unlock