

Question: 1. The following data shows the Air Pollution Index(API) for two regions Urban and Coun- tryside: Urban 80 70 90 76 84 Countryside 40 45
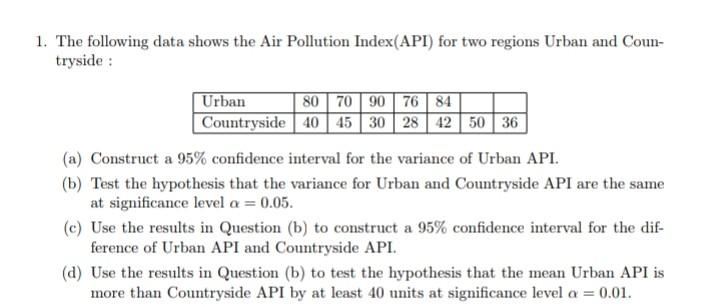
1. The following data shows the Air Pollution Index(API) for two regions Urban and Coun- tryside: Urban 80 70 90 76 84 Countryside 40 45 30 28 42 50 36 (a) Construct a 95% confidence interval for the variance of Urban API. (b) Test the hypothesis that the variance for Urban and Countryside API are the same at significance level a = 0.05. (c) Use the results in Question (b) to construct a 95% confidence interval for the dif- ference of Urban API and Countryside API. (d) Use the results in Question (b) to test the hypothesis that the mean Urban API is more than Countryside API by at least 40 units at significance level a = 0.01
Step by Step Solution
There are 3 Steps involved in it
1 Expert Approved Answer
Step: 1 Unlock

Question Has Been Solved by an Expert!
Get step-by-step solutions from verified subject matter experts
Step: 2 Unlock
Step: 3 Unlock