

The following table gives the age-adjusted cancer incidence rates (new cases) per 100,000 people for three...
Fantastic news! We've Found the answer you've been seeking!
Question:
Transcribed Image Text:
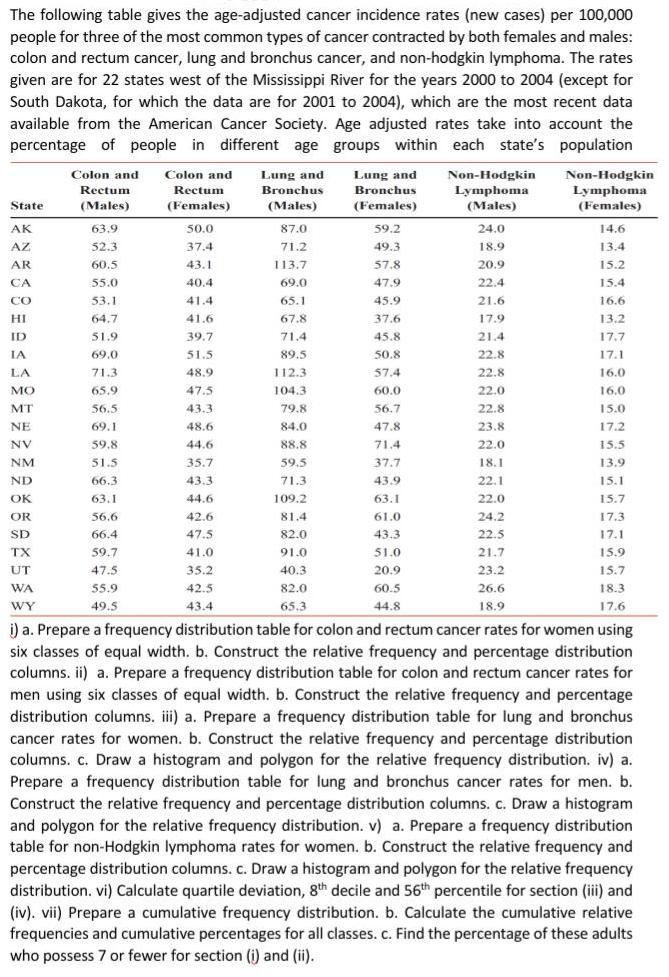
The following table gives the age-adjusted cancer incidence rates (new cases) per 100,000 people for three of the most common types of cancer contracted by both females and males: colon and rectum cancer, lung and bronchus cancer, and non-hodgkin lymphoma. The rates given are for 22 states west of the Mississippi River for the years 2000 to 2004 (except for South Dakota, for which the data are for 2001 to 2004), which are the most recent data available from the American Cancer Society. Age adjusted rates take into account the percentage of people in different age groups within each state's population Colon and Colon and Lung and Bronchus Lung and Non-Hodgkin Non-Hodgkin Lymphoma (Males) Lymphoma (Females) Rectum Rectum Bronchus State (Males) (Females) (Males) (Females) АК 63.9 50.0 87.0 59.2 24.0 14.6 AZ 52.3 37.4 71.2 49.3 18.9 13.4 AR 60.5 43.1 113.7 57.8 20.9 15.2 CA 55.0 40.4 69.0 47.9 22.4 15.4 CO 53.1 41.4 65.1 45.9 21.6 16.6 HI 64.7 41.6 67.8 37.6 17.9 13.2 ID 51.9 39.7 71.4 45.8 21.4 17.7 IA 69.0 51.5 89.5 50.8 22.8 17.1 LA 71.3 48.9 112.3 57.4 22.8 16.0 Мо 65.9 47.5 104.3 60.0 22.0 16.0 MT 56.5 43.3 79.8 56.7 22.8 15.0 NE 69.1 48.6 84.0 47.8 23.8 17.2 NV 59.8 44.6 88.8 71.4 22.0 15.5 NM 51.5 35.7 59.5 37.7 18.1 13.9 ND 66.3 43.3 71.3 43.9 22.1 15.1 OK 63.1 44.6 109.2 63.1 22.0 15.7 OR 56,6 42.6 81.4 61.0 24.2 17.3 SD 66.4 47.5 82.0 43.3 22.5 17.1 TX 59.7 41.0 91.0 51.0 21.7 15.9 UT 47.5 35.2 40.3 20.9 23.2 15.7 WA 55.9 42.5 82.0 60.5 26.6 18.3 WY 49.5 43.4 65.3 44.8 18.9 17.6 i) a. Prepare a frequency distribution table for colon and rectum cancer rates for women using six classes of equal width. b. Construct the relative frequency and percentage distribution columns. ii) a. Prepare a frequency distribution table for colon and rectum cancer rates for men using six classes of equal width. b. Construct the relative frequency and percentage distribution columns. iii) a. Prepare a frequency distribution table for lung and bronchus cancer rates for women. b. Construct the relative frequency and percentage distribution columns. c. Draw a histogram and polygon for the relative frequency distribution. iv) a. Prepare a frequency distribution table for lung and bronchus cancer rates for men. b. Construct the relative frequency and percentage distribution columns. c. Draw a histogram and polygon for the relative frequency distribution. v) a. Prepare a frequency distribution table for non-Hodgkin lymphoma rates for women. b. Construct the relative frequency and percentage distribution columns. c. Draw a histogram and polygon for the relative frequency distribution. vi) Calculate quartile deviation, 8th decile and 56th percentile for section (iii) and (iv). vii) Prepare a cumulative frequency distribution. b. Calculate the cumulative relative frequencies and cumulative percentages for all classes. c. Find the percentage of these adults who possess 7 or fewer for section (i) and (ii). The following table gives the age-adjusted cancer incidence rates (new cases) per 100,000 people for three of the most common types of cancer contracted by both females and males: colon and rectum cancer, lung and bronchus cancer, and non-hodgkin lymphoma. The rates given are for 22 states west of the Mississippi River for the years 2000 to 2004 (except for South Dakota, for which the data are for 2001 to 2004), which are the most recent data available from the American Cancer Society. Age adjusted rates take into account the percentage of people in different age groups within each state's population Colon and Colon and Lung and Bronchus Lung and Non-Hodgkin Non-Hodgkin Lymphoma (Males) Lymphoma (Females) Rectum Rectum Bronchus State (Males) (Females) (Males) (Females) АК 63.9 50.0 87.0 59.2 24.0 14.6 AZ 52.3 37.4 71.2 49.3 18.9 13.4 AR 60.5 43.1 113.7 57.8 20.9 15.2 CA 55.0 40.4 69.0 47.9 22.4 15.4 CO 53.1 41.4 65.1 45.9 21.6 16.6 HI 64.7 41.6 67.8 37.6 17.9 13.2 ID 51.9 39.7 71.4 45.8 21.4 17.7 IA 69.0 51.5 89.5 50.8 22.8 17.1 LA 71.3 48.9 112.3 57.4 22.8 16.0 Мо 65.9 47.5 104.3 60.0 22.0 16.0 MT 56.5 43.3 79.8 56.7 22.8 15.0 NE 69.1 48.6 84.0 47.8 23.8 17.2 NV 59.8 44.6 88.8 71.4 22.0 15.5 NM 51.5 35.7 59.5 37.7 18.1 13.9 ND 66.3 43.3 71.3 43.9 22.1 15.1 OK 63.1 44.6 109.2 63.1 22.0 15.7 OR 56,6 42.6 81.4 61.0 24.2 17.3 SD 66.4 47.5 82.0 43.3 22.5 17.1 TX 59.7 41.0 91.0 51.0 21.7 15.9 UT 47.5 35.2 40.3 20.9 23.2 15.7 WA 55.9 42.5 82.0 60.5 26.6 18.3 WY 49.5 43.4 65.3 44.8 18.9 17.6 i) a. Prepare a frequency distribution table for colon and rectum cancer rates for women using six classes of equal width. b. Construct the relative frequency and percentage distribution columns. ii) a. Prepare a frequency distribution table for colon and rectum cancer rates for men using six classes of equal width. b. Construct the relative frequency and percentage distribution columns. iii) a. Prepare a frequency distribution table for lung and bronchus cancer rates for women. b. Construct the relative frequency and percentage distribution columns. c. Draw a histogram and polygon for the relative frequency distribution. iv) a. Prepare a frequency distribution table for lung and bronchus cancer rates for men. b. Construct the relative frequency and percentage distribution columns. c. Draw a histogram and polygon for the relative frequency distribution. v) a. Prepare a frequency distribution table for non-Hodgkin lymphoma rates for women. b. Construct the relative frequency and percentage distribution columns. c. Draw a histogram and polygon for the relative frequency distribution. vi) Calculate quartile deviation, 8th decile and 56th percentile for section (iii) and (iv). vii) Prepare a cumulative frequency distribution. b. Calculate the cumulative relative frequencies and cumulative percentages for all classes. c. Find the percentage of these adults who possess 7 or fewer for section (i) and (ii).
Expert Answer:

Related Book For 

Numerical Methods for Engineers
ISBN: 9780071244299
5th Edition
Authors: Steven C. Chapra, Raymond P. Canale
Posted Date:
Students also viewed these mathematics questions
-
The following table gives data for real consumption expenditure, real income, real wealth, and real interest rates for the U.S. for the years 19472000. a. Given the data in the table, estimate the...
-
The demand for cable. The following table gives data used by a telephone cable manufacturer to predict sales to a major customer for the period 19681983. The variables in the table are defined as...
-
The following table gives selective data on nominal exchange rates, price levels, and real exchange rates for Country A and several other countries. Country A uses the dollar (A$) as its currency....
-
Shreya commutes in a CNG fitted van to school every day along with many other students. She told the van driver to get the CNG connection certified and timely checked it for any leakage or loose...
-
Since the 1950s, a massive shift in consumption patterns with respect to nondurable goods and services has taken place. What is this shift and how can it be explained?
-
Use the foot lengths and heights to find the best predicted height of a male who has a foot length of 28 cm. Would the result be helpful to police crime scene investigators in trying to describe the...
-
What are protists?
-
CompDesk, Inc., makes a single model of an ergonomic desk (with chair) for computer usage. The desk is manufactured in building 1, and the chair is manufactured in building 2. Monthly capacities and...
-
At Dominos pizza the time study restaurant yielded an average observed time of 4.0 minutes. The analyst rates the observed worker at 85%.this means the worker performed at 85% of normal when the...
-
In a sample of 539 households from a certain Midwestern city, it was found that 133 of these households owned at least one firearm. Give a 99% confidence interval for the percentage of families in...
-
The pressure of a gas in a well-sealed vertical frictionless piston-cylinder device is to be increased by adding a mass of 25 kg on the piston. If the diameter of the cylinder is 14 cm, find the...
-
Consider the vector v = a+1, b+1, where a = 6 is the second to last digit of your student ID and b = 9 is the last digit of your student ID. Plot this vector in the xy-plane. On the same plane, plot...
-
An object that has a mass of 535 kg is on a journey from the earth to the moon. If the distance from the center of the earth to the center of the moon is 385.000 km, what is the magnitude of the net...
-
As part of the current audit, the auditor performs a preliminary review of a large client's internal controls over accounts receivable. How is a recovery classified in accounting terms? What is the...
-
please explaine about The Black Panther Party The Black Panther Party for Self-Defense (BPP) was founded in October 1966 in Oakland, Californiaby Huey P. Newton and Bobby Seale, who met at Merritt...
-
How the spark types nurturer and sage fits with communication and leadership in healthcare?
-
youbought five call option contracts with a strike price of $47.50 andan option premium of $1.20. at expiration, the stock was sellingfor $51.30 a share and you exercised your option.a) what is th 2...
-
During 2012, Cheng Book Store paid $483,000 for land and built a store in Georgetown. Prior to construction, the city of Georgetown charged Cheng $1,300 for a building permit, which Cheng paid. Cheng...
-
Confirm the validity of the Cholesky decomposition of Example 11.2 by substituting the results into Eq. (11.2) to see if the product of [L] and T yields [A].
-
The following second-order ODE is considered to be stiff d2y/dx2= -l00l dy/dx - l000y Solve this differential equation (a) Analytically and (b) Numerically for x = 0 to 5. For (b) use an implicit...
-
The data below represents the bacterial growth in a liquid culture over a number of days. Find a best-fit equation to the data trend. Try several possibilities-linear, parabolic, and exponential. Use...
-
Kaplan gives several examples of the need to clearly explain the cafs purpose and goals. Identify specific assumptions or misconceptions that their audience may have. Why is managing or countering...
-
Do you have any additional tips and tricks you use to organize research results? If so, explain how they would be useful for this project.
-
What incentives do digital tools provide to circulate more rather than fewer paper documents? What incentives do companies have to reduce their use of paper? What tradeoffs or conflicts between these...

Study smarter with the SolutionInn App