

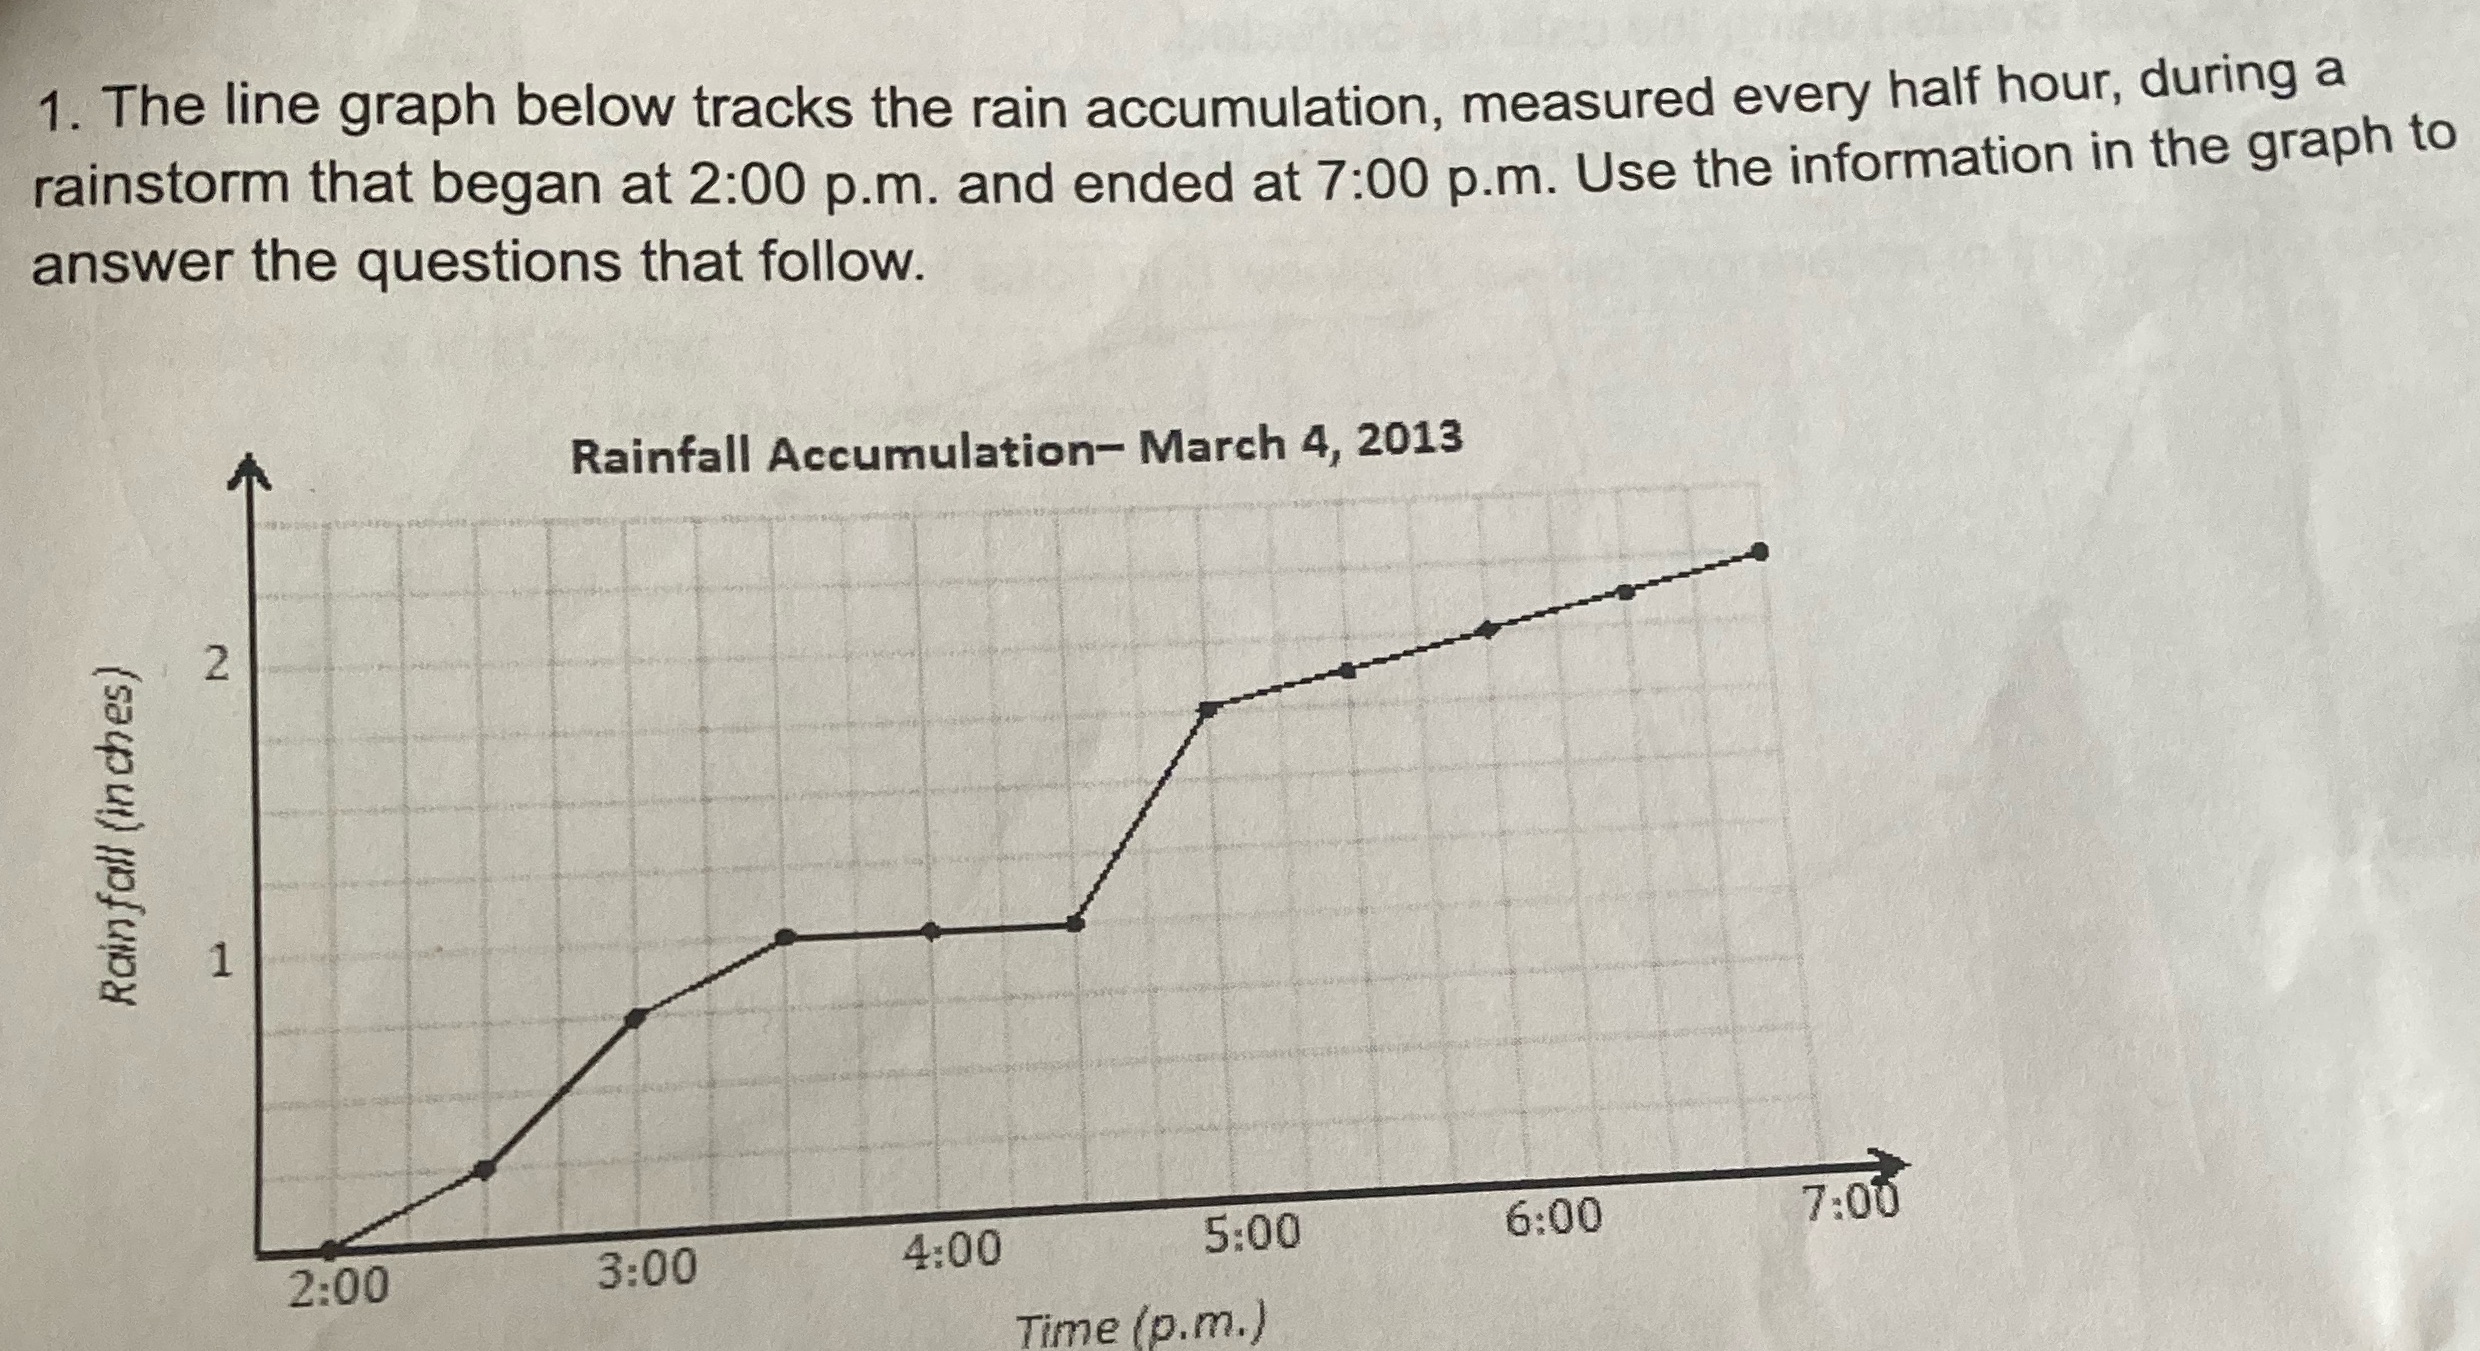
Question: 1. The line graph below tracks the rain accumulation, measured every half hour, during a rainstorm that began at 2:00 p.m. and ended at 7:00
Step by Step Solution
There are 3 Steps involved in it
1 Expert Approved Answer
Step: 1 Unlock

Question Has Been Solved by an Expert!
Get step-by-step solutions from verified subject matter experts
Step: 2 Unlock
Step: 3 Unlock