

Question: 1. The price level, earnings, and return data are given in real terms in units of December 31, 2012, dollars) in Exhibit 2. Why is
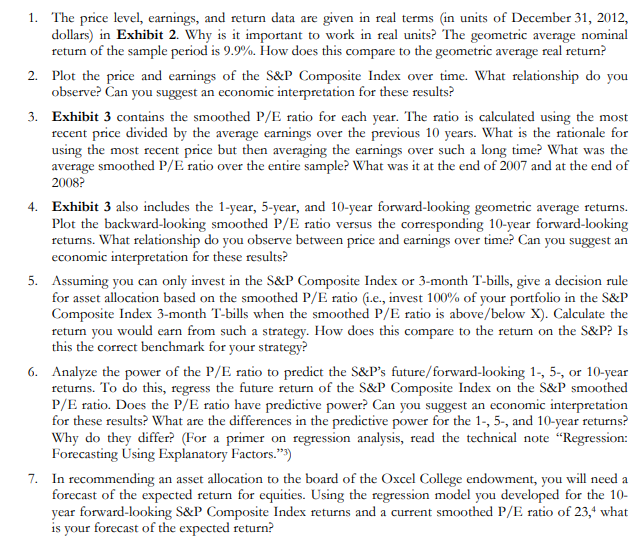
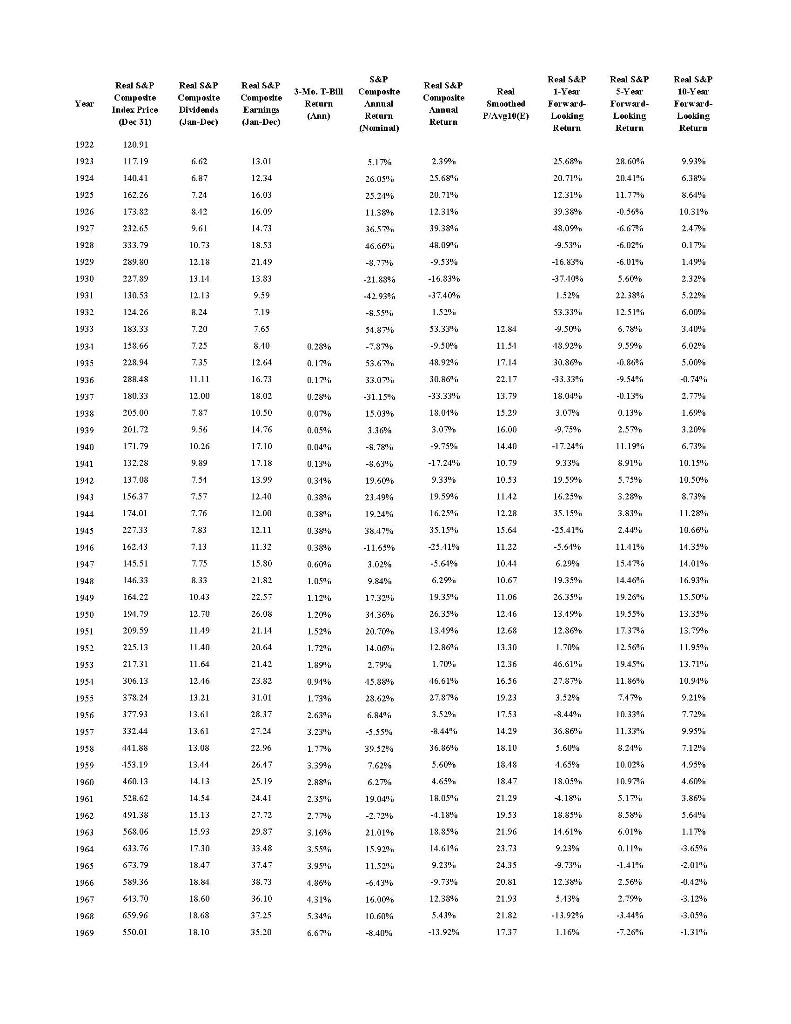
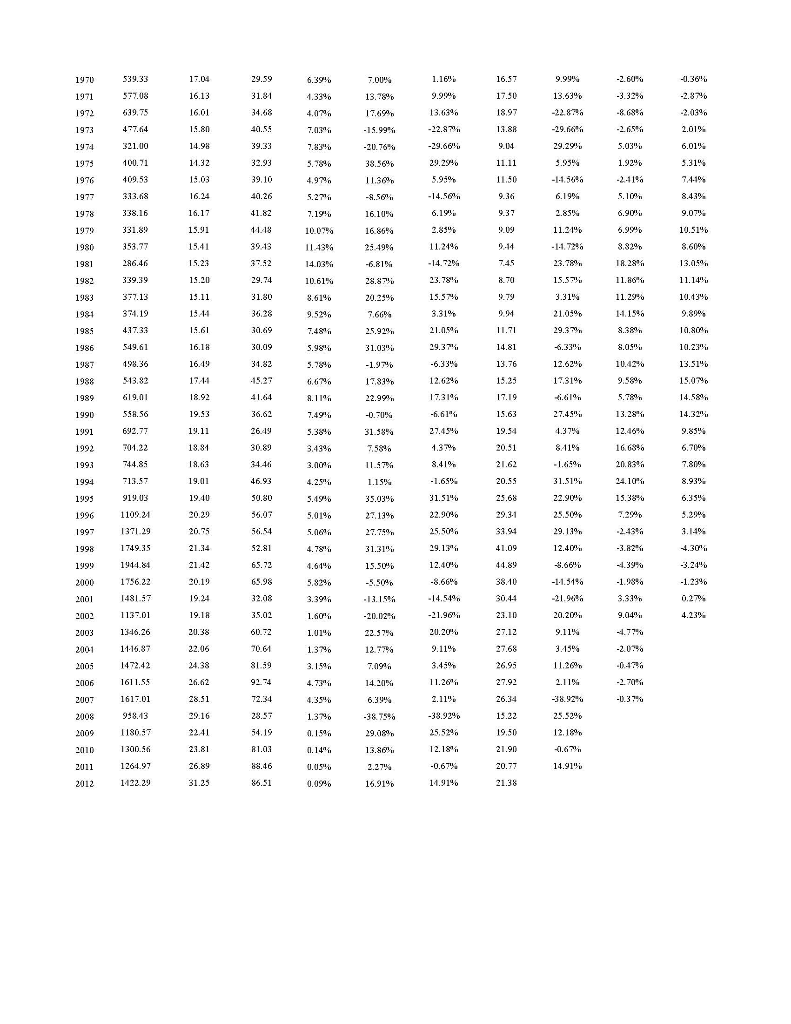
1. The price level, earnings, and return data are given in real terms in units of December 31, 2012, dollars) in Exhibit 2. Why is it important to work in real units? The geometric average nominal return of the sample period is 9.9%. How does this compare to the geometric average real return? 2. Plot the price and earnings of the S&P Composite Index over time. What relationship do you observe? Can you suggest an economic interpretation for these results? 3. Exhibit 3 contains the smoothed P/E ratio for each year. The ratio is calculated using the most recent price divided by the average earnings over the previous 10 years. What is the rationale for using the most recent price but then averaging the earnings over such a long time? What was the average smoothed P/E ratio over the entire sample? What was it at the end of 2007 and at the end of 2008? 4. Exhibit 3 also includes the 1-year, 5-year, and 10-year forward-looking geometric average returns. Plot the backward-looking smoothed P/E ratio versus the corresponding 10-year forward-looking returns. What relationship do you observe between price and earnings over time? Can you suggest an economic interpretation for these results? 5. Assuming you can only invest in the S&P Composite Index or 3-month T-bills, give a decision rule for asset allocation based on the smoothed P/E ratio i.e., invest 100% of your portfolio in the S&P Composite Index 3-month T-bills when the smoothed P/E ratio is above/below X). Calculate the return you would earn from such a strategy. How does this compare to the return on the S&P? Is this the correct benchmark for your strategy 6. Analyze the power of the P/E ratio to predict the S&P's future/forward-looking 1., 5., or 10-year returns. To do this, regress the future return of the S&P Composite Index on the S&P smoothed P/E ratio. Does the P/E ratio have predictive power? Can you suggest an economic interpretation for these results? What are the differences in the predictive power for the 1., 5., and 10-year returns? Why do they differ? (For a primer on regression analysis, read the technical note "Regression: Forecasting Using Explanatory Factors.3) 7. In recommending an asset allocation to the board of the Oxcel College endowment, you will need a forecast of the expected return for equities. Using the regression model you developed for the 10- year forward-looking S&P Composite Index returns and a current smoothed P/E ratio of 23,4 what is your forecast of the expected return? Year Real S&P Compadre Index Price (Dec 31) Real S&P Composite Dividends (Jan-Dec) Real S&P Composite Earnings (Jaun-Dec) 3-Mo. T-BA Recern (Ann) S&P Composte Annual Recara (Nonina) Real S&P Composite suunal Return Real Smoothed P/Avg10(E) Real S&P 1-Year Forward- Looking Relurn Real S&P 5-Yen Forward- Looking Return Real S&P 10-Year Formand- Looking Return 2.36 9.93% 7.21 8.12 28.6096 20.41% 11.77% -0.36% 20.71% 12.31% 39.38% 1922 1922 1924 1923 1926 1927 1928 1929 1930 1931 1932 1933 193-1 13.01 12.34 16.03 16:09 14.73 19.53 21.49 13.33 25.68% 20.71% 12.31% 19.38% 43.094 9.61 5.17% 26.05 25.21% 11.38% 36.57 46.66% -8.77% -21.83% 8.61% 10.31% 2.47% 0.17" 1.49% -6.01% 10.73 12.18 13.11 12.13 -16.83% -37.10% -16.83% -37.40 1.52%. 22.389 5.22% 6.00% 12.51% 51.87% 6.78% 53.33% -9.50% -18.92% 30.86% 9.56 6.02% 5.00% 48.9246 30.8691 1936 1937 1938 7.20 7.25 7.35 11.11 12.00 7.87 9.58 10.26 0.28% 0.16 0.17% 0.28% 0.0N 0.05% 0.04% 0.13% 0.31% 0.38% 0.3841 53.67 33.07% -31.15% 15.09% 1.36% 18.01% 3.07 -9.54% -0.13% 0.13% 2.57% 11.19% 8.91" 9.89 1940 1941 1912 1943 1944 -17.24" 9.33% 19.5946 7.51 120.91 117.19 140.41 162.26 173.82 232.65 333.79 289.80 227.89 130,53 124.26 183.33 138.65 228.94 288.48 180.33 205.00 201.72 171.79 132.28 137.08 156,37 174.01 227.33 162.13 145.51 146.33 164.22 19.79 209.59 225.13 21 7.31 306.13 378.24 377.93 332.44 441.88 -153.19 460.13 528.62 191.38 568.06 633.76 673.79 589.36 18.04 3.07% -9.75% -17.24% 9.33% 19.58% 16.25% 3.5.1.5% -23.41% 757 -5.63% 19.66 23.49% 19.24% 38.47% -11.53% 3.02% 7.19 7.65 840 12.64 16.73 18.02 10.50 14.76 17.10 17.18 13.99 12:40 12.00 12.11 11.32 15.80 21.82 22.5 26.08 21.14 20.64 21.42 23.82 31.01 28.37 27:24 22.96 26.17 1945 1916 7.13 11.41% 15.47% 8.33 1948 1949 1930 1951 1952 1953 1951 0.3846 0.6046 1.0.591 1.129 1.2014 1.529 1.72% 35.15% -23:11% -5,61% 6.299 19.3.5" 26.354 13.4946 17.32% 31.36% 20.70 14.00 12.84 11.51 17.14 22.17 13.79 15.29 16.00 14.40 10.79 10.33 11:42 12.28 15.64 11.22 104-1 10.67 11.06 12.16 12.68 13.30 12.36 16.56 19.23 17.53 14.29 18.10 1848 18.47 21.29 19.53 21.96 22.73 24.35 20.81 21.93 21.82 17.37 6.29% 19.35% 26.35": 13.19% 12.86% 19.26% 19.55% 17.37% 12.56% 19.45% 11.86% 14 2.77% 1.69% 3.20% 6.73% 10.15 10.50% 8.73% 11.28% 10.66% 11.35% 14.01% 16.9.% 15.50% 13.35% 13.764 11.9.59 13.71" 10.31% 9.21% 7.729 9.95%. 7.12% 1.95% 4.60% 3.86". 5.61% 1.17 1.89' 0.91% 1.79% 1.70%. 16.61% 27.87% 46.61% 27.87% 3.52% 10.43 12.70 1149 11.40 11.64 12.16 13.21 13.61 13.61 13.08 13.44 14.13 14.54 13.13 13.93 17.30 18.47 18.81 18.60 18.68 16.10 19.561 1957 3.23% 1.774 3.3946 2.8896 28.62% 6.8494 -5.95% 39.32% 7.62% 6.27% 19.04": 36.86% 5.60% 36.86% 3.60% 1.65% 18.05% 11.3.394 8.21% 10.02% 10.97% 5.12% 1959 1960 1961 1962 1963 1964 1963 18.0.5" 24.41 27.72 29.87 33.48 2.77 3.1696 3.5.500 21.01% 18.8546 6.01% 0.11% -2.01% 18.85% 11,61% 9.23% -9.73% 12.38% A3% -13.92% 1.16% 1966 2.56% 11.52% -6.13% 16.00% 10.60% 38.73 36.10 3725 1967 1968 1969 4.86% 4.31% 5.34% 6.67 659.96 550.01 -9.73% 12.38% 5.4.3% -13.92% 3.12% -3.0.5% -1.31% 6.39% 1.16% -2.60% 29.59 31.81 34.68 7.00% 13.78% 16.57 17.30 18.97 9.99% 13.53% 1.33% -2.87% 4.0M 1970 1971 1972 1973 1974 1973 13.63% -22.87 40.55 13.88 39.33 5.03" 1.92% 2.01% 6.01% 3.31% 539.33 577.08 699.75 477.64 321.00 100.71 409.53 383.68 338.16 331.89 353.77 286.465 339 39 29.294 5.95% 11.11 11.50 32.93 39.10 40.26 41.82 5.10 6.19% - 15.99% -20.76% 33.56% 11.36% -8.56" 16.10% 16.86% 23.49% -6.81% 28.87" 20.23% 9.3: 17.04 16.13 16.01 15.80 14.98 11.32 15.03 16.24 16.17 15.91 15.41 15.23 15.20 13.11 1344 15.61 16.18 16.49 7.83% 5.78% 4.97% 5.274 7.19% 10.09% 1143% 14.03% 10.61% 8.61% 9.52% 6.19% 2.85% 11.21% - 1-1.7296 9.079 10.51% 1977 1978 1979 1980 1981 1982 1983 1981 1985 1986 1987 1988 1989 1990 1991 39,3 8.70 9.79 18.28 11.86% 11.29% 14.15% 377.13 374.19 4.37.33 29.74 31.80 36.28 30.69 30.09 31.82 15.5?" 3.31% 21.05% 29.3 11.2496 -14.72% 23.78% 15.37% 3.31% 21.0.5 29.37" -6.33% 12.6246 17.31% -6.6144 11.11 8.38% S.OS" 10.42% 549.61 498.36 513.82 619.01 558.56 692.77 101.22 25.92% 31.03 -1.97% 17.87% 22.999%. -0.70% 31.38% 7.58% 5.78% 6,67% A.116 7.49% 18.92 19.53 19.11 18.84 18.63 19.01 13.0.59 11.14" 10.13% 9.894 10.80 10.23" 13.51% 15.07 14.58% 14.324 9.85% 6.70% 7.80% 14.81 13.76 15.25 17.19 15.63 19.54 20.51 21.62 20.55 25.68 29.3-1 41.64 36.62 26.49 30.89 12.62% 17.31% 6.61% 27.4.5" 4.37% 841% 1992 3.43% 3.00 5.79% 13.28% 12.46% 16.63% 20.839 24.10% 15.38% 8.93% 1.15% 35.03% 27.13% 6.35% 1993 1994 1993 1996 1997 1998 1999 2000 2001 5.49% 5.01% 5.0696 46.93 50.80 56.07 56.54 52.81 65.72 65.98 32.08 1.37% 8.41% -1.65%. 31.51% 22.90% 25.50 29.1.3" 12.40% 31.51% 22.90% 28.57% 29.13% 12.40% 41.09 4.3041 31.31% 15.50% 4.394 -1.98% -13.1594 -20.02% -1-1.31% -21.96 20,20% -1.23% 0.27% 4.23%. 2002 35.02 9.04% 713.57 919.03 1109.31 1371.29 1749.35 1944.84 1756.22 148137 1137.01 1346.26 11-16.37 1472.42 1611.55 1617.01 938.13 118037 1300.56 1264.97 1422.29 5.82% 3.39% 1.60% 1.0196 1.3M 3.1.546 4.731 -14.54% -21.96". 20.20% 9.11% 9.11% -2.00% 21.34 21.42 20:19 19.24 19.18 20.38 22.05 24,38 26.62 28.51 29.16 2241 23.81 26.89 31.23 12.77% 7.09% 14.20% 2003 2001 2005 2006 2007 2008 2009 2010 2011 2012 2.11% -2.70 -1.37% 38.10 30.44 23.10 27.12 27.68 26.95 27.92 26.34 13.22 19.50 21.90 20.77 21.38 60.72 70.61 8159 92.54 72.34 28.57 54.19 R1.03 88.46 85.51 -38 78% 25.53% 11.2016 2.119 -33.934 25.5290 12.1895 -0.67% 14.91% 1.37% 0.15% 13.86" 12.18 -0.67 14.91% 0.09% 16.91% 1. The price level, earnings, and return data are given in real terms in units of December 31, 2012, dollars) in Exhibit 2. Why is it important to work in real units? The geometric average nominal return of the sample period is 9.9%. How does this compare to the geometric average real return? 2. Plot the price and earnings of the S&P Composite Index over time. What relationship do you observe? Can you suggest an economic interpretation for these results? 3. Exhibit 3 contains the smoothed P/E ratio for each year. The ratio is calculated using the most recent price divided by the average earnings over the previous 10 years. What is the rationale for using the most recent price but then averaging the earnings over such a long time? What was the average smoothed P/E ratio over the entire sample? What was it at the end of 2007 and at the end of 2008? 4. Exhibit 3 also includes the 1-year, 5-year, and 10-year forward-looking geometric average returns. Plot the backward-looking smoothed P/E ratio versus the corresponding 10-year forward-looking returns. What relationship do you observe between price and earnings over time? Can you suggest an economic interpretation for these results? 5. Assuming you can only invest in the S&P Composite Index or 3-month T-bills, give a decision rule for asset allocation based on the smoothed P/E ratio i.e., invest 100% of your portfolio in the S&P Composite Index 3-month T-bills when the smoothed P/E ratio is above/below X). Calculate the return you would earn from such a strategy. How does this compare to the return on the S&P? Is this the correct benchmark for your strategy 6. Analyze the power of the P/E ratio to predict the S&P's future/forward-looking 1., 5., or 10-year returns. To do this, regress the future return of the S&P Composite Index on the S&P smoothed P/E ratio. Does the P/E ratio have predictive power? Can you suggest an economic interpretation for these results? What are the differences in the predictive power for the 1., 5., and 10-year returns? Why do they differ? (For a primer on regression analysis, read the technical note "Regression: Forecasting Using Explanatory Factors.3) 7. In recommending an asset allocation to the board of the Oxcel College endowment, you will need a forecast of the expected return for equities. Using the regression model you developed for the 10- year forward-looking S&P Composite Index returns and a current smoothed P/E ratio of 23,4 what is your forecast of the expected return? Year Real S&P Compadre Index Price (Dec 31) Real S&P Composite Dividends (Jan-Dec) Real S&P Composite Earnings (Jaun-Dec) 3-Mo. T-BA Recern (Ann) S&P Composte Annual Recara (Nonina) Real S&P Composite suunal Return Real Smoothed P/Avg10(E) Real S&P 1-Year Forward- Looking Relurn Real S&P 5-Yen Forward- Looking Return Real S&P 10-Year Formand- Looking Return 2.36 9.93% 7.21 8.12 28.6096 20.41% 11.77% -0.36% 20.71% 12.31% 39.38% 1922 1922 1924 1923 1926 1927 1928 1929 1930 1931 1932 1933 193-1 13.01 12.34 16.03 16:09 14.73 19.53 21.49 13.33 25.68% 20.71% 12.31% 19.38% 43.094 9.61 5.17% 26.05 25.21% 11.38% 36.57 46.66% -8.77% -21.83% 8.61% 10.31% 2.47% 0.17" 1.49% -6.01% 10.73 12.18 13.11 12.13 -16.83% -37.10% -16.83% -37.40 1.52%. 22.389 5.22% 6.00% 12.51% 51.87% 6.78% 53.33% -9.50% -18.92% 30.86% 9.56 6.02% 5.00% 48.9246 30.8691 1936 1937 1938 7.20 7.25 7.35 11.11 12.00 7.87 9.58 10.26 0.28% 0.16 0.17% 0.28% 0.0N 0.05% 0.04% 0.13% 0.31% 0.38% 0.3841 53.67 33.07% -31.15% 15.09% 1.36% 18.01% 3.07 -9.54% -0.13% 0.13% 2.57% 11.19% 8.91" 9.89 1940 1941 1912 1943 1944 -17.24" 9.33% 19.5946 7.51 120.91 117.19 140.41 162.26 173.82 232.65 333.79 289.80 227.89 130,53 124.26 183.33 138.65 228.94 288.48 180.33 205.00 201.72 171.79 132.28 137.08 156,37 174.01 227.33 162.13 145.51 146.33 164.22 19.79 209.59 225.13 21 7.31 306.13 378.24 377.93 332.44 441.88 -153.19 460.13 528.62 191.38 568.06 633.76 673.79 589.36 18.04 3.07% -9.75% -17.24% 9.33% 19.58% 16.25% 3.5.1.5% -23.41% 757 -5.63% 19.66 23.49% 19.24% 38.47% -11.53% 3.02% 7.19 7.65 840 12.64 16.73 18.02 10.50 14.76 17.10 17.18 13.99 12:40 12.00 12.11 11.32 15.80 21.82 22.5 26.08 21.14 20.64 21.42 23.82 31.01 28.37 27:24 22.96 26.17 1945 1916 7.13 11.41% 15.47% 8.33 1948 1949 1930 1951 1952 1953 1951 0.3846 0.6046 1.0.591 1.129 1.2014 1.529 1.72% 35.15% -23:11% -5,61% 6.299 19.3.5" 26.354 13.4946 17.32% 31.36% 20.70 14.00 12.84 11.51 17.14 22.17 13.79 15.29 16.00 14.40 10.79 10.33 11:42 12.28 15.64 11.22 104-1 10.67 11.06 12.16 12.68 13.30 12.36 16.56 19.23 17.53 14.29 18.10 1848 18.47 21.29 19.53 21.96 22.73 24.35 20.81 21.93 21.82 17.37 6.29% 19.35% 26.35": 13.19% 12.86% 19.26% 19.55% 17.37% 12.56% 19.45% 11.86% 14 2.77% 1.69% 3.20% 6.73% 10.15 10.50% 8.73% 11.28% 10.66% 11.35% 14.01% 16.9.% 15.50% 13.35% 13.764 11.9.59 13.71" 10.31% 9.21% 7.729 9.95%. 7.12% 1.95% 4.60% 3.86". 5.61% 1.17 1.89' 0.91% 1.79% 1.70%. 16.61% 27.87% 46.61% 27.87% 3.52% 10.43 12.70 1149 11.40 11.64 12.16 13.21 13.61 13.61 13.08 13.44 14.13 14.54 13.13 13.93 17.30 18.47 18.81 18.60 18.68 16.10 19.561 1957 3.23% 1.774 3.3946 2.8896 28.62% 6.8494 -5.95% 39.32% 7.62% 6.27% 19.04": 36.86% 5.60% 36.86% 3.60% 1.65% 18.05% 11.3.394 8.21% 10.02% 10.97% 5.12% 1959 1960 1961 1962 1963 1964 1963 18.0.5" 24.41 27.72 29.87 33.48 2.77 3.1696 3.5.500 21.01% 18.8546 6.01% 0.11% -2.01% 18.85% 11,61% 9.23% -9.73% 12.38% A3% -13.92% 1.16% 1966 2.56% 11.52% -6.13% 16.00% 10.60% 38.73 36.10 3725 1967 1968 1969 4.86% 4.31% 5.34% 6.67 659.96 550.01 -9.73% 12.38% 5.4.3% -13.92% 3.12% -3.0.5% -1.31% 6.39% 1.16% -2.60% 29.59 31.81 34.68 7.00% 13.78% 16.57 17.30 18.97 9.99% 13.53% 1.33% -2.87% 4.0M 1970 1971 1972 1973 1974 1973 13.63% -22.87 40.55 13.88 39.33 5.03" 1.92% 2.01% 6.01% 3.31% 539.33 577.08 699.75 477.64 321.00 100.71 409.53 383.68 338.16 331.89 353.77 286.465 339 39 29.294 5.95% 11.11 11.50 32.93 39.10 40.26 41.82 5.10 6.19% - 15.99% -20.76% 33.56% 11.36% -8.56" 16.10% 16.86% 23.49% -6.81% 28.87" 20.23% 9.3: 17.04 16.13 16.01 15.80 14.98 11.32 15.03 16.24 16.17 15.91 15.41 15.23 15.20 13.11 1344 15.61 16.18 16.49 7.83% 5.78% 4.97% 5.274 7.19% 10.09% 1143% 14.03% 10.61% 8.61% 9.52% 6.19% 2.85% 11.21% - 1-1.7296 9.079 10.51% 1977 1978 1979 1980 1981 1982 1983 1981 1985 1986 1987 1988 1989 1990 1991 39,3 8.70 9.79 18.28 11.86% 11.29% 14.15% 377.13 374.19 4.37.33 29.74 31.80 36.28 30.69 30.09 31.82 15.5?" 3.31% 21.05% 29.3 11.2496 -14.72% 23.78% 15.37% 3.31% 21.0.5 29.37" -6.33% 12.6246 17.31% -6.6144 11.11 8.38% S.OS" 10.42% 549.61 498.36 513.82 619.01 558.56 692.77 101.22 25.92% 31.03 -1.97% 17.87% 22.999%. -0.70% 31.38% 7.58% 5.78% 6,67% A.116 7.49% 18.92 19.53 19.11 18.84 18.63 19.01 13.0.59 11.14" 10.13% 9.894 10.80 10.23" 13.51% 15.07 14.58% 14.324 9.85% 6.70% 7.80% 14.81 13.76 15.25 17.19 15.63 19.54 20.51 21.62 20.55 25.68 29.3-1 41.64 36.62 26.49 30.89 12.62% 17.31% 6.61% 27.4.5" 4.37% 841% 1992 3.43% 3.00 5.79% 13.28% 12.46% 16.63% 20.839 24.10% 15.38% 8.93% 1.15% 35.03% 27.13% 6.35% 1993 1994 1993 1996 1997 1998 1999 2000 2001 5.49% 5.01% 5.0696 46.93 50.80 56.07 56.54 52.81 65.72 65.98 32.08 1.37% 8.41% -1.65%. 31.51% 22.90% 25.50 29.1.3" 12.40% 31.51% 22.90% 28.57% 29.13% 12.40% 41.09 4.3041 31.31% 15.50% 4.394 -1.98% -13.1594 -20.02% -1-1.31% -21.96 20,20% -1.23% 0.27% 4.23%. 2002 35.02 9.04% 713.57 919.03 1109.31 1371.29 1749.35 1944.84 1756.22 148137 1137.01 1346.26 11-16.37 1472.42 1611.55 1617.01 938.13 118037 1300.56 1264.97 1422.29 5.82% 3.39% 1.60% 1.0196 1.3M 3.1.546 4.731 -14.54% -21.96". 20.20% 9.11% 9.11% -2.00% 21.34 21.42 20:19 19.24 19.18 20.38 22.05 24,38 26.62 28.51 29.16 2241 23.81 26.89 31.23 12.77% 7.09% 14.20% 2003 2001 2005 2006 2007 2008 2009 2010 2011 2012 2.11% -2.70 -1.37% 38.10 30.44 23.10 27.12 27.68 26.95 27.92 26.34 13.22 19.50 21.90 20.77 21.38 60.72 70.61 8159 92.54 72.34 28.57 54.19 R1.03 88.46 85.51 -38 78% 25.53% 11.2016 2.119 -33.934 25.5290 12.1895 -0.67% 14.91% 1.37% 0.15% 13.86" 12.18 -0.67 14.91% 0.09% 16.91%
Step by Step Solution
There are 3 Steps involved in it

Get step-by-step solutions from verified subject matter experts