

Question: 1. The relevant data are provided in Project Data 1. The data consist of the monthly adjusted closing prices of ASSET and SPY (SPDR S&P
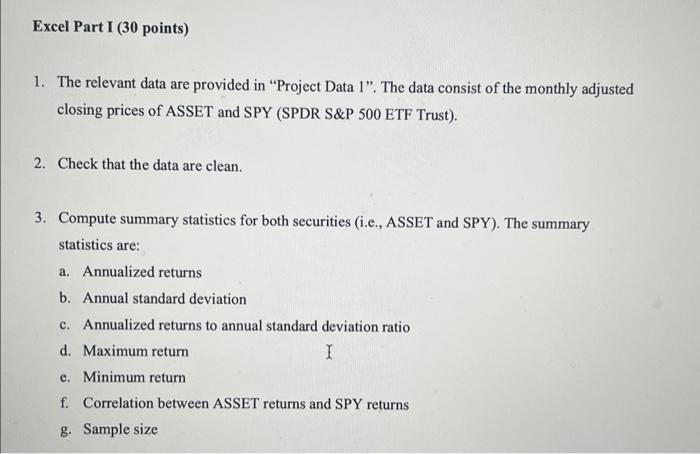
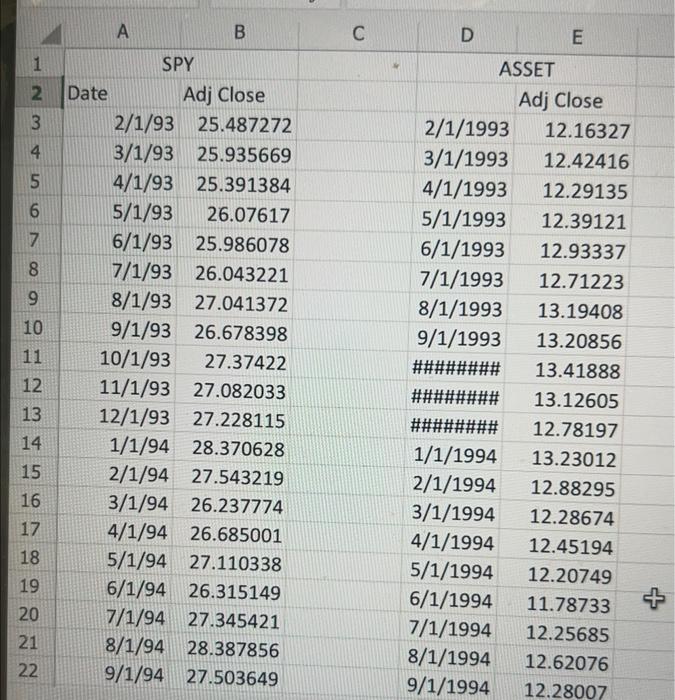
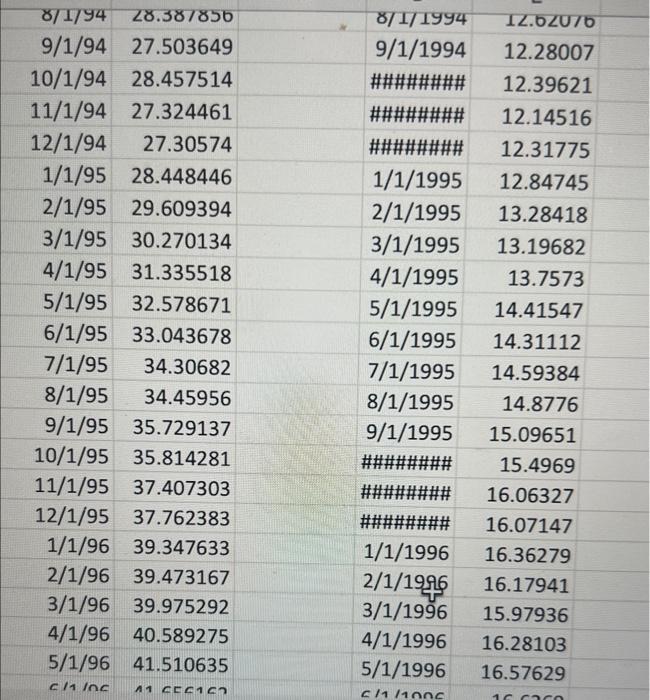
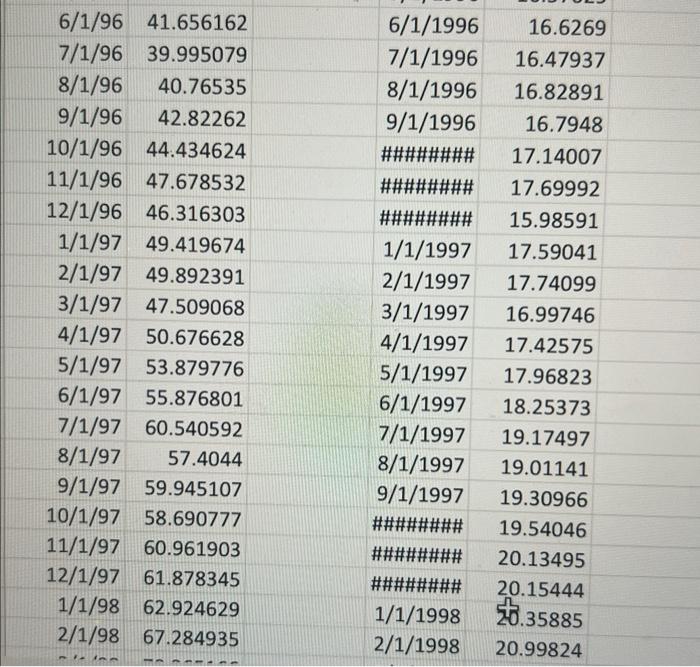
1. The relevant data are provided in "Project Data 1". The data consist of the monthly adjusted closing prices of ASSET and SPY (SPDR S\&P 500 ETF Trust). 2. Check that the data are clean. 3. Compute summary statistics for both securities (i.e., ASSET and SPY). The summary statistics are: a. Annualized returns b. Annual standard deviation c. Annualized returns to annual standard deviation ratio d. Maximum return e. Minimum return f. Correlation between ASSET returns and SPY returns g. Sample size \begin{tabular}{|r|r|r|r|} \hline 6/1/96 & 41.656162 & 6/1/1996 & 16.6269 \\ \hline 7/1/96 & 39.995079 & 7/1/1996 & 16.47937 \\ \hline 8/1/96 & 40.76535 & 8/1/1996 & 16.82891 \\ \hline 9/1/96 & 42.82262 & 9/1/1996 & 16.7948 \\ \hline 10/1/96 & 44.434624 & \#\#\#\#\#\#\# & 17.14007 \\ \hline 11/1/96 & 47.678532 & \#\#\#\#\#\#\#\# & 17.69992 \\ \hline 12/1/96 & 46.316303 & \#\#\#\#\#\#\#\# & 15.98591 \\ \hline 1/1/97 & 49.419674 & 1/1/1997 & 17.59041 \\ \hline 2/1/97 & 49.892391 & 2/1/1997 & 17.74099 \\ \hline 3/1/97 & 47.509068 & 3/1/1997 & 16.99746 \\ \hline 4/1/97 & 50.676628 & 4/1/1997 & 17.42575 \\ \hline 5/1/97 & 53.879776 & 5/1/1997 & 17.96823 \\ \hline 6/1/97 & 55.876801 & 6/1/1997 & 18.25373 \\ \hline 7/1/97 & 60.540592 & 7/1/1997 & 19.17497 \\ \hline 8/1/97 & 57.4044 & 8/1/1997 & 19.01141 \\ \hline 9/1/97 & 59.945107 & 9/1/1997 & 19.30966 \\ \hline 10/1/97 & 58.690777 & \#\#\#\#\#\#\# & 19.54046 \\ \hline 11/1/97 & 60.961903 & \#\#\#\#\#\#\# & 20.13495 \\ \hline 12/1/97 & 61.878345 & \#\#\#\#\#\#\#\# & 20.15444 \\ \hline 1/1/98 & 62.924629 & 1/1/1998 & 20.35885 \\ \hline 2/1/98 & 67.284935 & 2/1/1998 & 20.99824 \\ \hline-19 & 5.5 & & \\ \hline \end{tabular} 1. The relevant data are provided in "Project Data 1". The data consist of the monthly adjusted closing prices of ASSET and SPY (SPDR S\&P 500 ETF Trust). 2. Check that the data are clean. 3. Compute summary statistics for both securities (i.e., ASSET and SPY). The summary statistics are: a. Annualized returns b. Annual standard deviation c. Annualized returns to annual standard deviation ratio d. Maximum return e. Minimum return f. Correlation between ASSET returns and SPY returns g. Sample size \begin{tabular}{|r|r|r|r|} \hline 6/1/96 & 41.656162 & 6/1/1996 & 16.6269 \\ \hline 7/1/96 & 39.995079 & 7/1/1996 & 16.47937 \\ \hline 8/1/96 & 40.76535 & 8/1/1996 & 16.82891 \\ \hline 9/1/96 & 42.82262 & 9/1/1996 & 16.7948 \\ \hline 10/1/96 & 44.434624 & \#\#\#\#\#\#\# & 17.14007 \\ \hline 11/1/96 & 47.678532 & \#\#\#\#\#\#\#\# & 17.69992 \\ \hline 12/1/96 & 46.316303 & \#\#\#\#\#\#\#\# & 15.98591 \\ \hline 1/1/97 & 49.419674 & 1/1/1997 & 17.59041 \\ \hline 2/1/97 & 49.892391 & 2/1/1997 & 17.74099 \\ \hline 3/1/97 & 47.509068 & 3/1/1997 & 16.99746 \\ \hline 4/1/97 & 50.676628 & 4/1/1997 & 17.42575 \\ \hline 5/1/97 & 53.879776 & 5/1/1997 & 17.96823 \\ \hline 6/1/97 & 55.876801 & 6/1/1997 & 18.25373 \\ \hline 7/1/97 & 60.540592 & 7/1/1997 & 19.17497 \\ \hline 8/1/97 & 57.4044 & 8/1/1997 & 19.01141 \\ \hline 9/1/97 & 59.945107 & 9/1/1997 & 19.30966 \\ \hline 10/1/97 & 58.690777 & \#\#\#\#\#\#\# & 19.54046 \\ \hline 11/1/97 & 60.961903 & \#\#\#\#\#\#\# & 20.13495 \\ \hline 12/1/97 & 61.878345 & \#\#\#\#\#\#\#\# & 20.15444 \\ \hline 1/1/98 & 62.924629 & 1/1/1998 & 20.35885 \\ \hline 2/1/98 & 67.284935 & 2/1/1998 & 20.99824 \\ \hline-19 & 5.5 & & \\ \hline \end{tabular}
Step by Step Solution
There are 3 Steps involved in it

Get step-by-step solutions from verified subject matter experts