

Question: 1. The scatterplot shows the payroll (in millions of dollars) and number o Major League Baseball teams in 2016, along with the least-squares re The
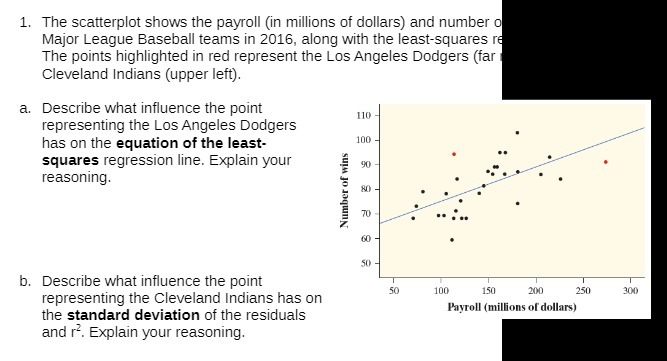
1. The scatterplot shows the payroll (in millions of dollars) and number o Major League Baseball teams in 2016, along with the least-squares re The points highlighted in red represent the Los Angeles Dodgers (far Cleveland Indians (upper left). a. Describe what influence the point representing the Los Angeles Dodgers 110 has on the equation of the least- 100 squares regression line. Explain your 90 reasoning. Number of wins 70 b. Describe what influence the point representing the Cleveland Indians has on 50 100 150 200 250 300 the standard deviation of the residuals Payroll (millions of dollars) and r. Explain your reasoning
Step by Step Solution
There are 3 Steps involved in it
1 Expert Approved Answer
Step: 1 Unlock

Question Has Been Solved by an Expert!
Get step-by-step solutions from verified subject matter experts
Step: 2 Unlock
Step: 3 Unlock