

Question: 1 ) The speed - time graph for a cart is shown to the right. Which of the following force diagrams could represent a cart
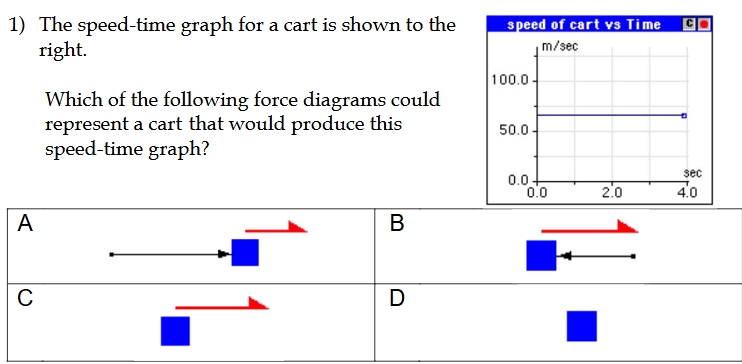
The speedtime graph for a cart is shown to the right.
Which of the following force diagrams could represent a cart that would produce this speedtime graph?
Step by Step Solution
There are 3 Steps involved in it
1 Expert Approved Answer
Step: 1 Unlock

Question Has Been Solved by an Expert!
Get step-by-step solutions from verified subject matter experts
Step: 2 Unlock
Step: 3 Unlock