

Question: 1. The table below gives the change in function values for the functions f, g, and h for certain intervals of x. Consider the
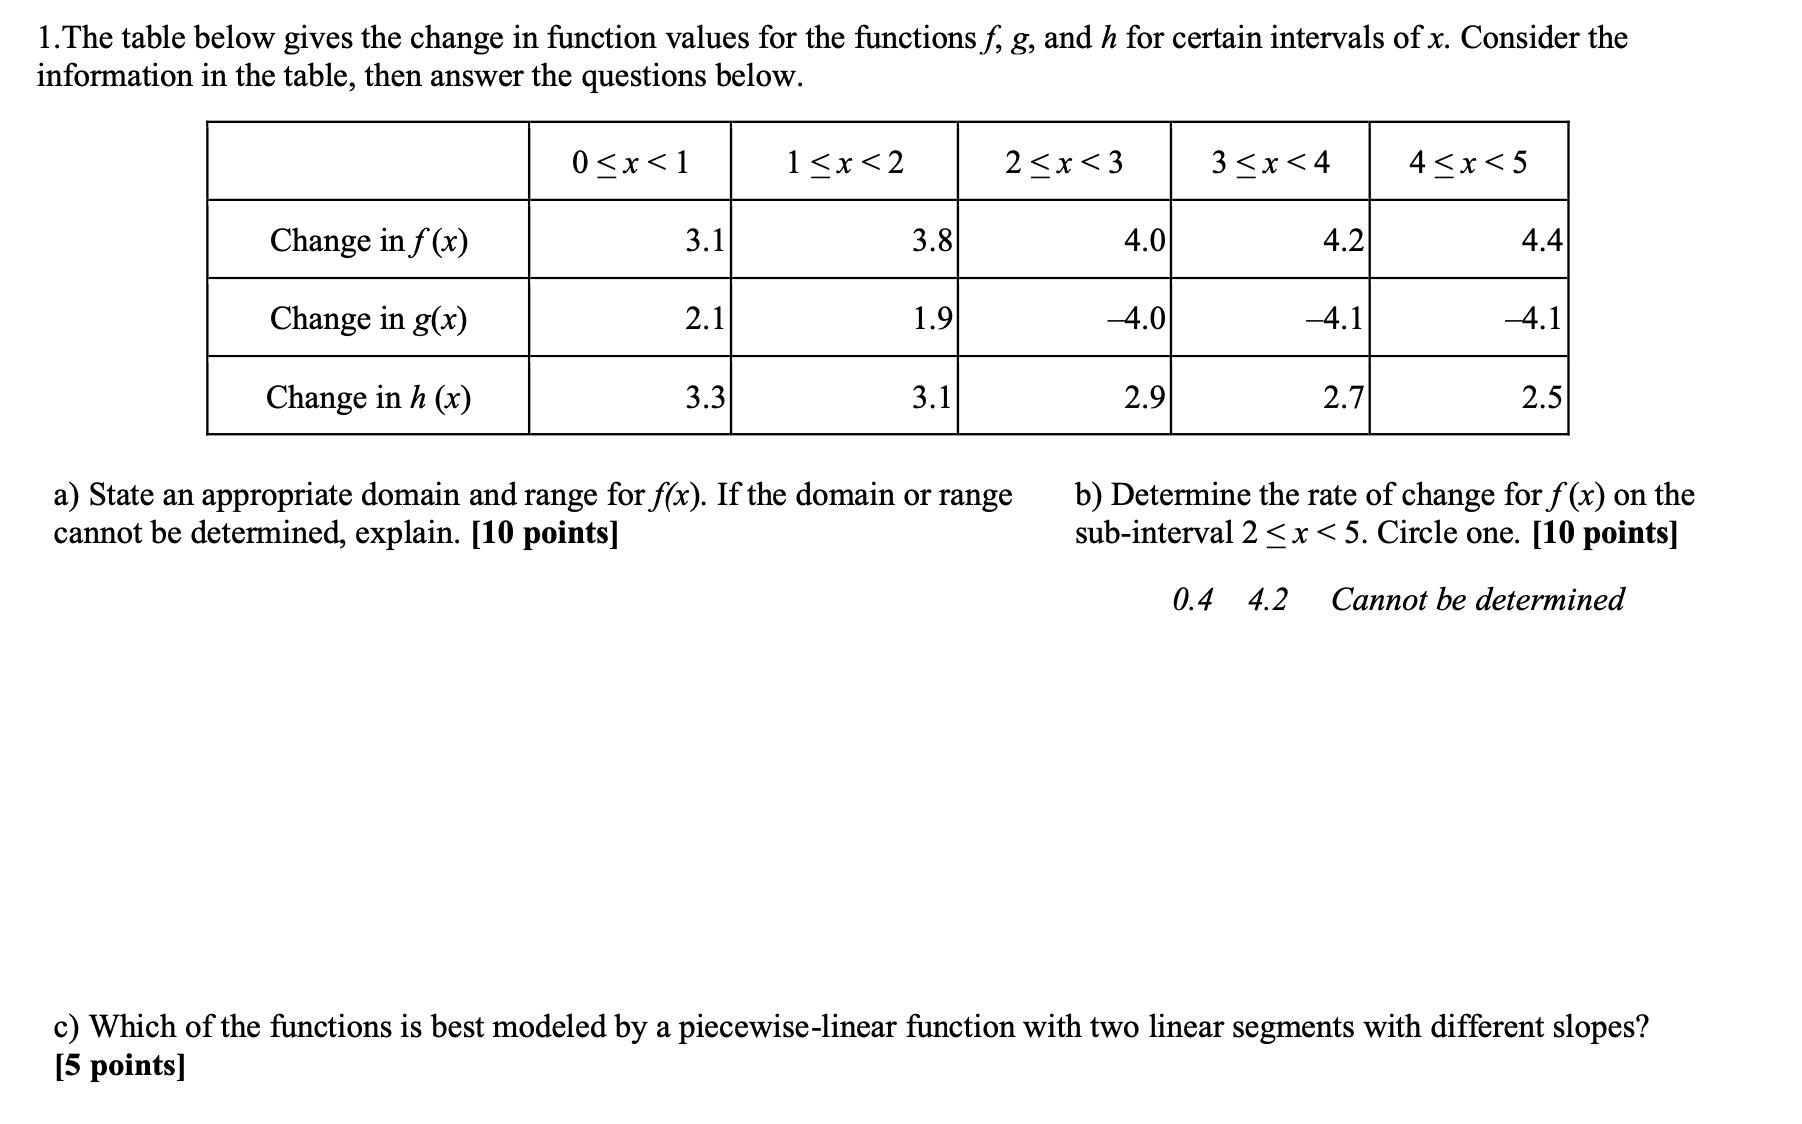
1. The table below gives the change in function values for the functions f, g, and h for certain intervals of x. Consider the information in the table, then answer the questions below. 0x1 1x2 2x3 3x4 4x5 Change in f(x) 3.1 3.8 4.0 4.2 4.4 Change in g(x) 2.1 1.9 -4.0 -4.1 -4.1 Change in h (x) 3.3 3.1 2.9 2.7 2.5 a) State an appropriate domain and range for f(x). If the domain or range cannot be determined, explain. [10 points] b) Determine the rate of change for f(x) on the sub-interval 2 < x < 5. Circle one. [10 points] 0.4 4.2 Cannot be determined c) Which of the functions is best modeled by a piecewise-linear function with two linear segments with different slopes? [5 points]
Step by Step Solution
There are 3 Steps involved in it

Get step-by-step solutions from verified subject matter experts