

Question: 1. The table below shows the study time and test scores for a number of students. Study 10 15 18 25 35 41 50 Time(min)
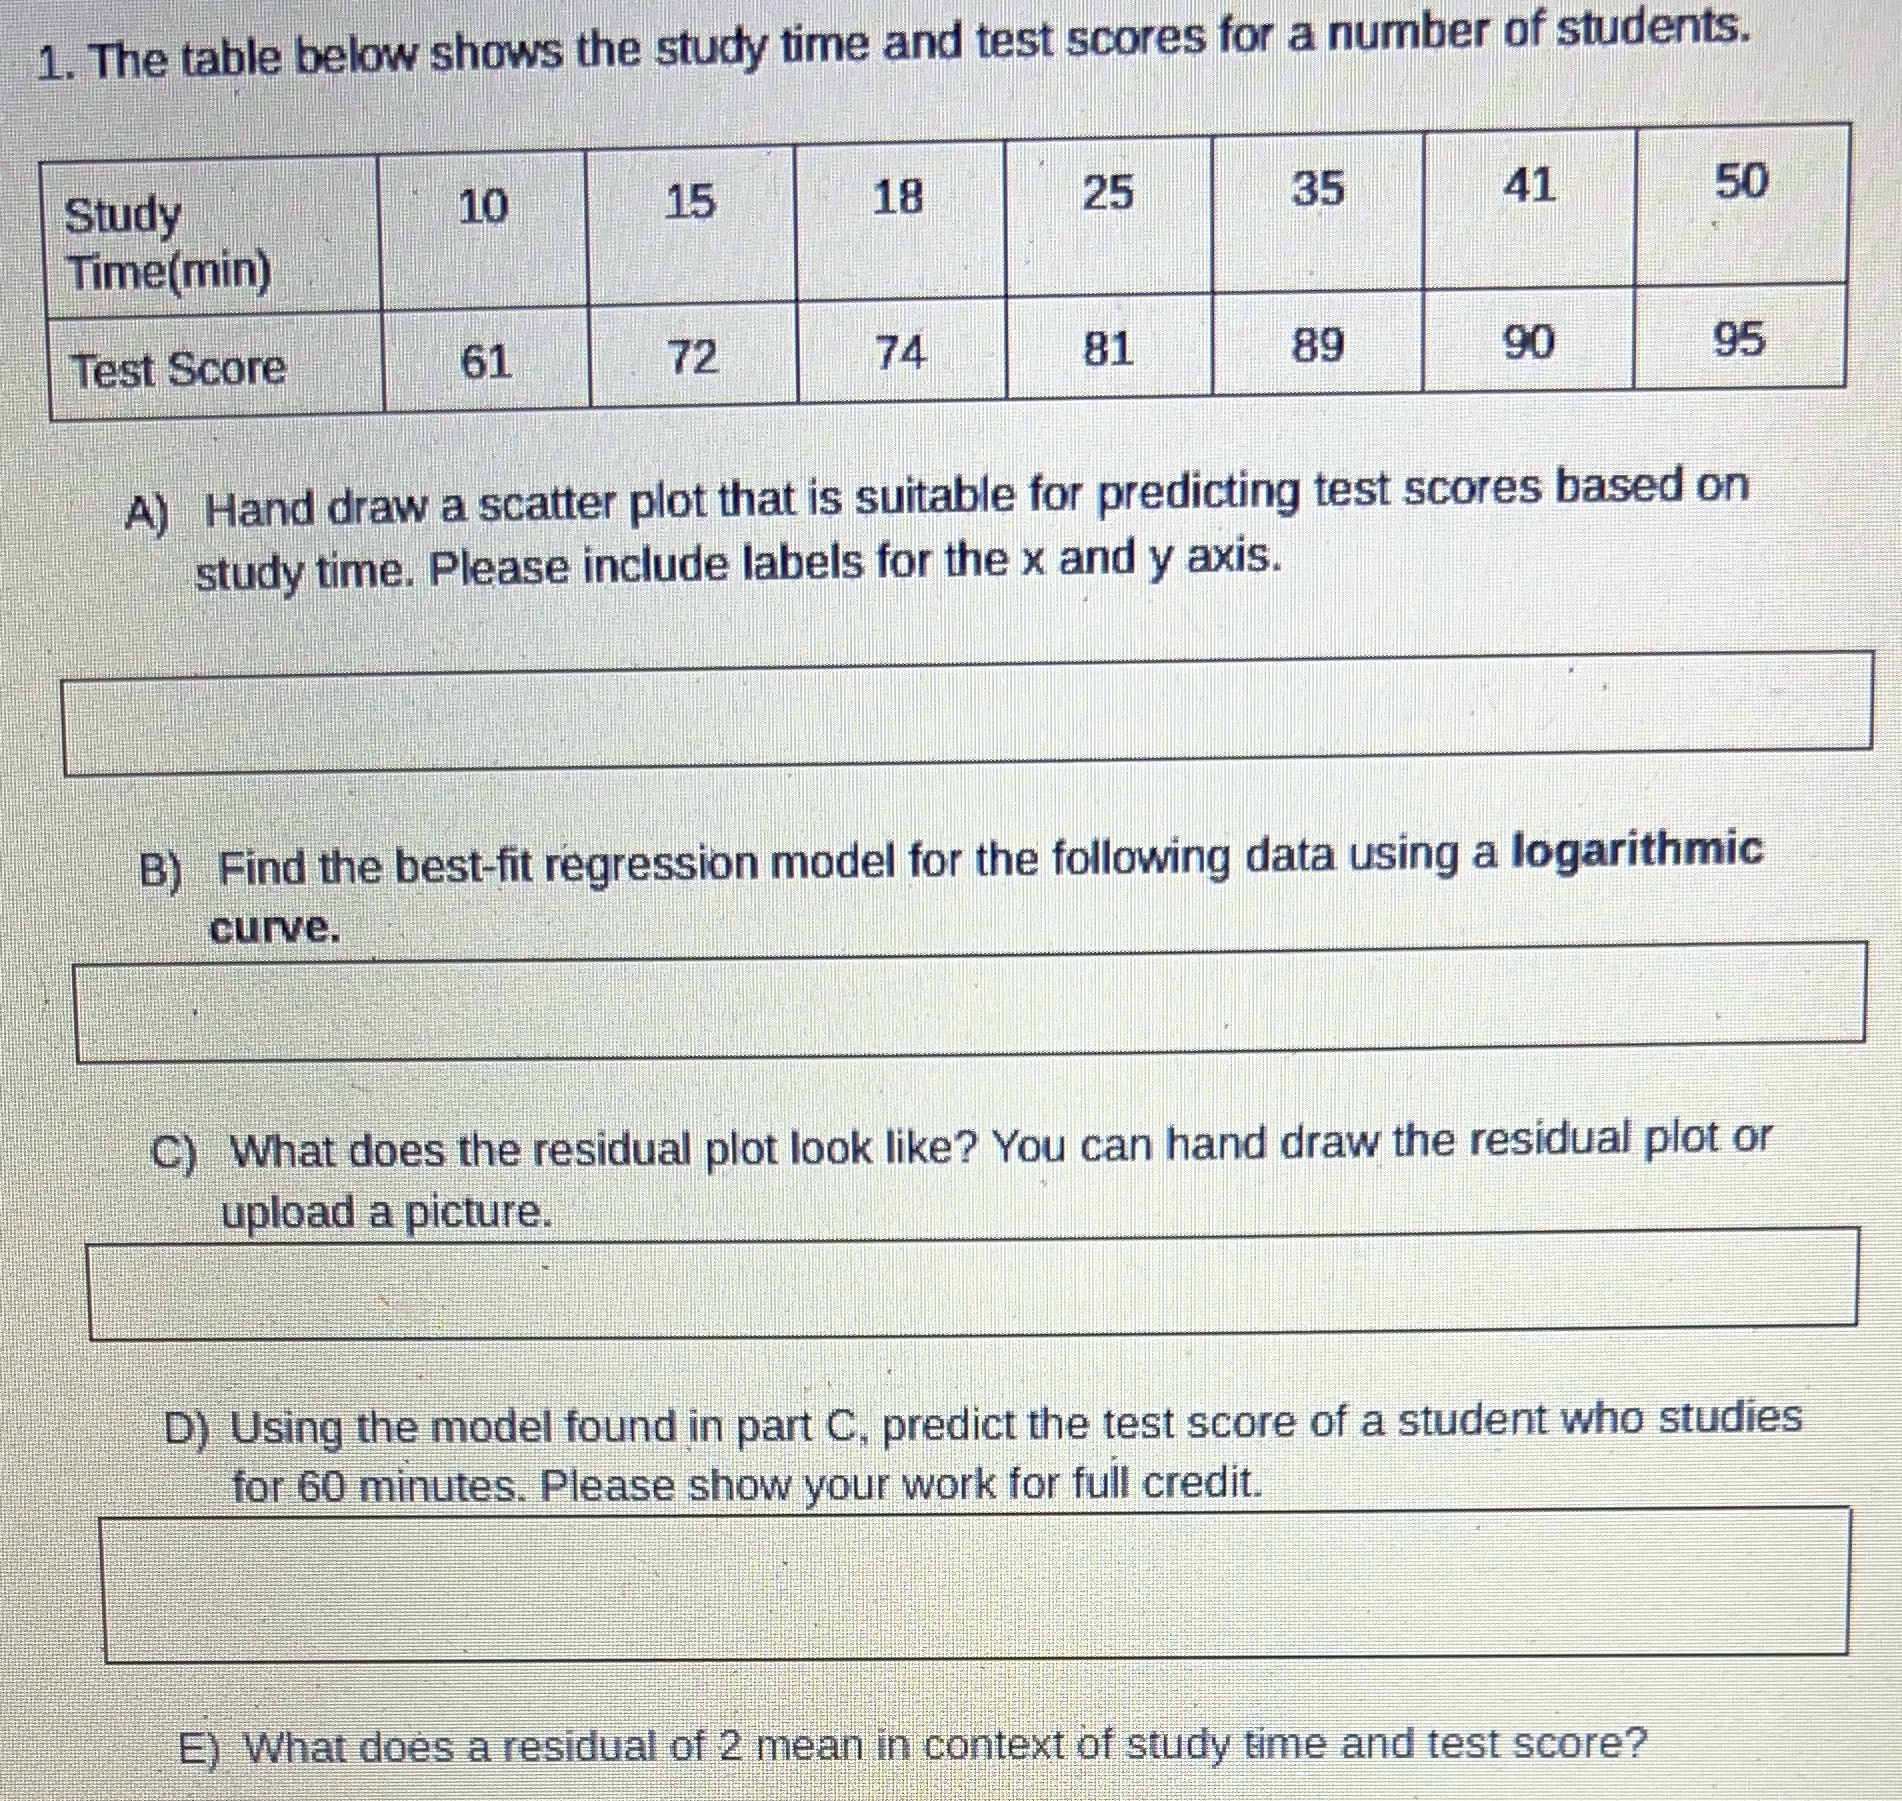
1. The table below shows the study time and test scores for a number of students. Study 10 15 18 25 35 41 50 Time(min) Test Score 61 72 74 81 89 90 95 A) Hand draw a scatter plot that is suitable for predicting test scores based on study time. Please include labels for the x and y axis. B) Find the best-fit regression model for the following data using a logarithmic curve. C) What does the residual plot look like? You can hand draw the residual plot or upload a picture. D) Using the model found in part C, predict the test score of a student who studies for 60 minutes. Please show your work for full credit. E) What does a residual of 2 mean in context of study time and test score
Step by Step Solution
There are 3 Steps involved in it

Get step-by-step solutions from verified subject matter experts