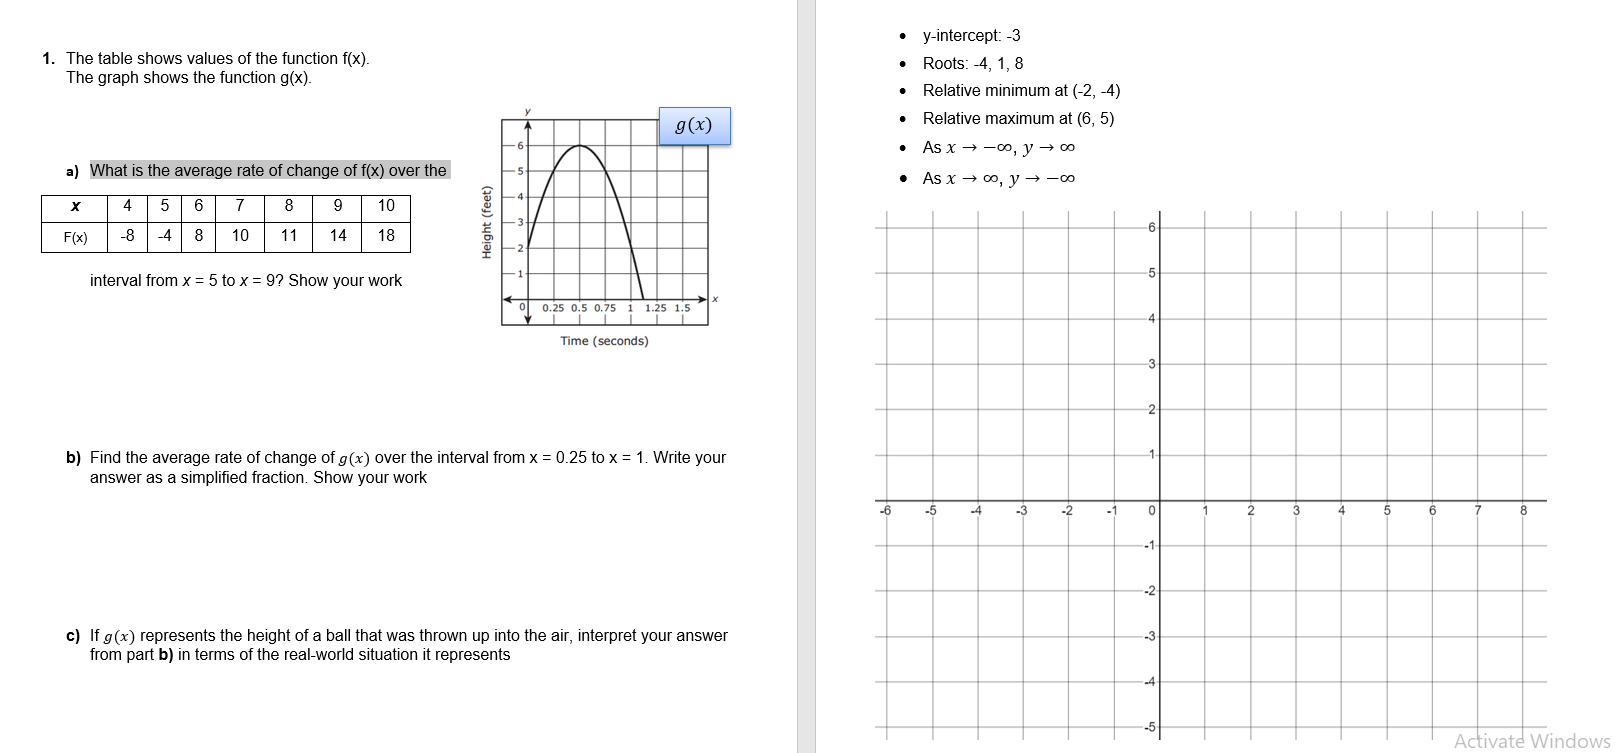
Question: 1. The table shows values of the function x). The graph shows the function got), x45678910 F(x)34181011 1413 Height eet) interval from x: 5 to

1. The table shows values of the function x). The
1. The table shows values of the function x). The graph shows the function got), x45678910 F(x)34181011 1413 Height eet) interval from x: 5 to x = 9? Show your work Tlme (seconds) In) Find the average rate 01 change ng(x] over the interval from x : (125 to x : 1, Write your answer as a simplied fraction. Show your work c) It 3(2) represents the height of a ball that was thrown up into the air, interpret your answer from part b] in terms of the realeworld situation it represents yintercept: 3 Roots: 4, 1, 8 Relative minimum at (72, 4) Relative maximum at (6, 5) A5 5: ) unI y ) m Asxamayaim Activate Windows

Step by Step Solution

There are 3 Steps involved in it

1 Expert Approved Answer
Step: 1 Unlock blur-text-image
Question Has Been Solved by an Expert!

Get step-by-step solutions from verified subject matter experts

Step: 2 Unlock
Step: 3 Unlock

Students Have Also Explored These Related Mathematics Questions!