

Question: 1. The upper and lower 3-sigma control chart limits are UCLp= LCLp= The results of inspection of DNA samples taken over the past 10 days
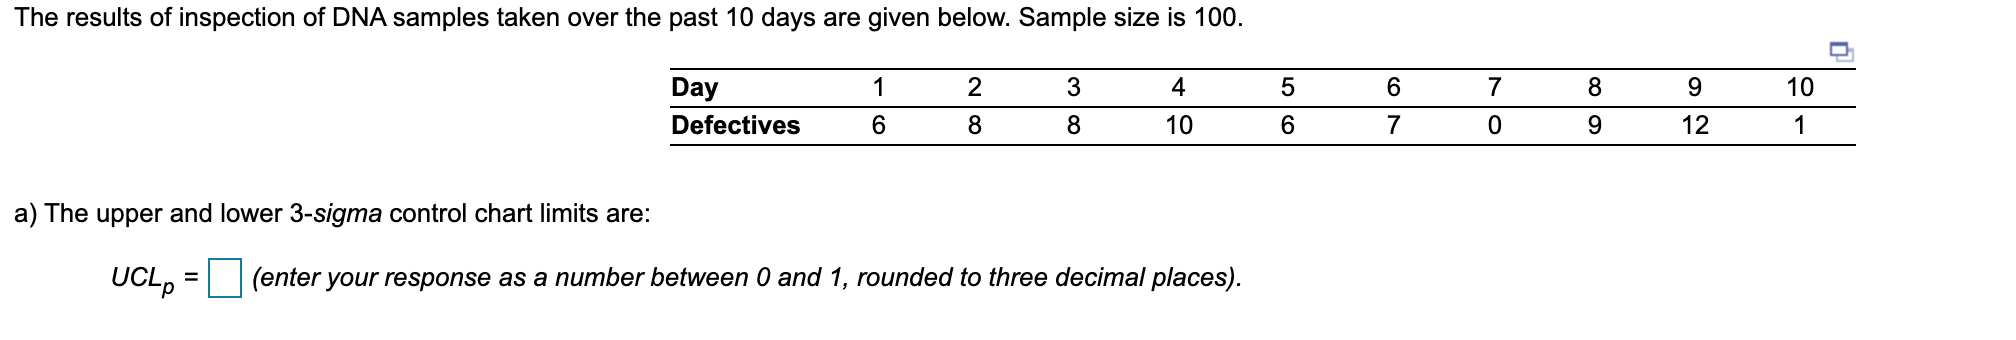
1. The upper and lower 3-sigma control chart limits are
UCLp=
LCLp=
Step by Step Solution
There are 3 Steps involved in it
1 Expert Approved Answer
Step: 1 Unlock

Question Has Been Solved by an Expert!
Get step-by-step solutions from verified subject matter experts
Step: 2 Unlock
Step: 3 Unlock