

Question: 1) This data set contains observations. 1 MARK 2) Which pair of these variables exhibits the highest degree of linear dependence? Answer: and 1 MARK
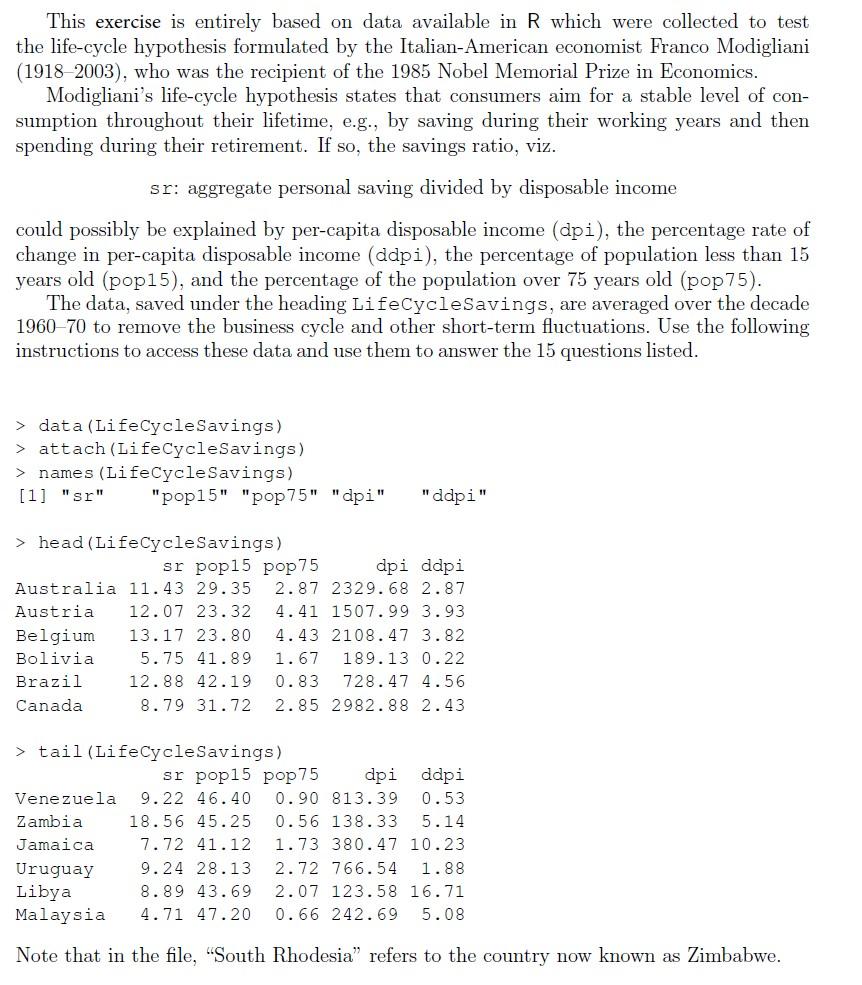
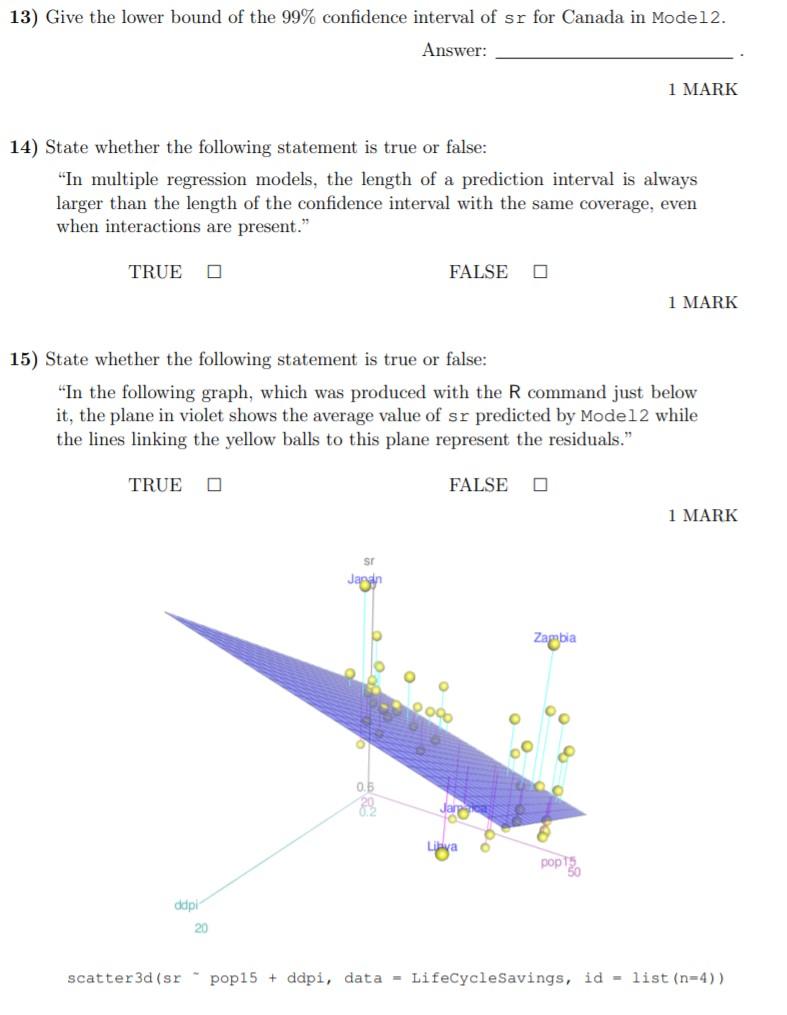
1) This data set contains observations. 1 MARK 2) Which pair of these variables exhibits the highest degree of linear dependence? Answer: and 1 MARK 3) Name the two countries which are outliers in the boxplot of variable ddpi. Answer: and 1 MARK Use the following R command to fit a multiple regression model for sr and rely on the output to answer Questions 4-7. Modell data (LifeCycleSavings) attach (LifeCycleSavings) names (LifeCycleSavings) [1] "sr" "pop15" "pop75" "dpi" " ddpi" head (LifeCycleSavings) sr pop15 pop75 api ddpi Australia 11. 43 29.35 2. 87 2329. 68 2.87 Austria 12. 07 23.32 4. 41 1507. 99 3.93 Belgium 13. 17 23.80 4. 43 2108. 47 3. 82 Bolivia 5.75 41.89 1. 67 189.13 0.22 Brazil 12. 88 42. 19 0. 83 728. 47 4.56 Canada 8. 79 31. 72 2. 85 2982. 88 2.43 > tail (LifeCycleSavings) sr pop15 pop75 dpi ddpi Venezuela 9. 22 46. 40 0.90 813.39 0. 53 Zambia 18 . 56 45.25 0. 56 138. 33 5.14 Jamaica 7. 72 41.12 1. 73 380. 47 10.23 Uruguay 9. 24 28.13 2. 72 766. 54 1.88 Libya 8. 89 43.69 2. 07 123. 58 16.71 Malaysia 4. 71 47.20 0. 66 242. 69 5.08 Note that in the file, "South Rhodesia" refers to the country now known as Zimbabwe.13) Give the lower bound of the 99% condence interval of or for Canada in Model 2. Answer: .h1AEUK 14) State whether the following statement is true or false: \"In multiple regression models, the length of a prediction interval is always larger than the length of the oondenee interml with the same coverage, even when interactions are present.\" TRUE [:1 FALSE E! 1 MK 15) State whether the following statement is true or false: \"In the following graph, which was produced with the R command just below it, the plane in violet shows the average value of a: predicted by Modelz while the lines linking the yellow balls to this plane represent the residuals.\" TRUE E] FALSE [:1 1 MARK 21] scatter3dtsr * poplS + ddpi, data - LifeCyoleSavinga, id - listtn-dll
Step by Step Solution
There are 3 Steps involved in it

Get step-by-step solutions from verified subject matter experts