

Question: 1 Transform the figures in Table 2 into one comparable measure of risk by expressing each probability as a decimal, rounded to four decimal places.
1Transform the figures in Table 2 into one comparable measure of risk by expressing each probability as a decimal, rounded to four decimal places.
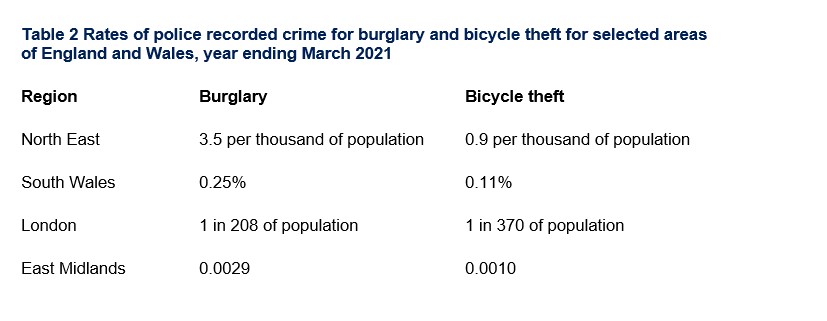
Table 2 Rates of police recorded crime for burglary and bicycle theft for selected areas of England and Wales, year ending March 2&21 Region Burglary Bicycle theft North East 3.5 per thousand of population 0.9 per thousand of population South Wales 0.25% 0.11% London 1 in 203 of population 1 in 370 of population East Midlands 0.0029 0.0010
Step by Step Solution
There are 3 Steps involved in it
1 Expert Approved Answer
Step: 1 Unlock

Question Has Been Solved by an Expert!
Get step-by-step solutions from verified subject matter experts
Step: 2 Unlock
Step: 3 Unlock