

Question: 1. Transform the following 1-D data using a Kerel function so that the data points of class label 1 (denoted with circles) and class label
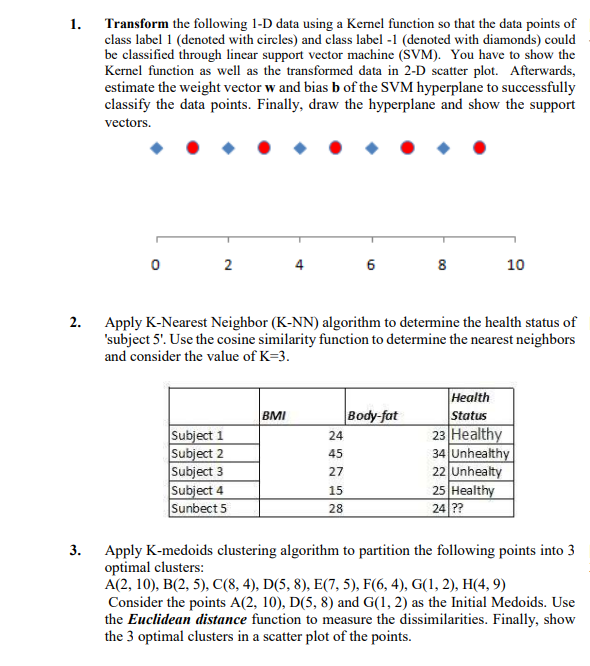
1. Transform the following 1-D data using a Kerel function so that the data points of class label 1 (denoted with circles) and class label -1 (denoted with diamonds) could be classified through linear support vector machine (SVM). You have to show the Kernel function as well as the transformed data in 2-D scatter plot. Afterwards, estimate the weight vector w and bias b of the SVM hyperplane to successfully classify the data points. Finally, draw the hyperplane and show the support vectors. 0 2 4 6 8 10 2. Apply K-Nearest Neighbor (K-NN) algorithm to determine the health status of 'subject 5'. Use the cosine similarity function to determine the nearest neighbors and consider the value of K=3. BMI Subject 1 Subject 2 Subject 3 Subject 4 Sunbect 5 Body-fat 24 45 27 15 28 Health Status 23 Healthy 34 Unhealthy 22 Unhealty 25 Healthy 24 ?? 3. Apply K-medoids clustering algorithm to partition the following points into 3 optimal clusters: A(2, 10), B(2,5), C(8,4), D(5,8), E(7,5), F(6, 4), G(1, 2), H(4,9) Consider the points A(2, 10), D(5, 8) and G(1, 2) as the Initial Medoids. Use the Euclidean distance function to measure the dissimilarities. Finally, show the 3 optimal clusters in a scatter plot of the points
Step by Step Solution
There are 3 Steps involved in it

Get step-by-step solutions from verified subject matter experts