

Question: 1. Upper Control Limit: 2. Lower Control Limit: 3. Has the process been in control: Develop a 3 standard deviation ( 99.73% confidence) p-chart and
1. Upper Control Limit:
2. Lower Control Limit:
3. Has the process been in control:
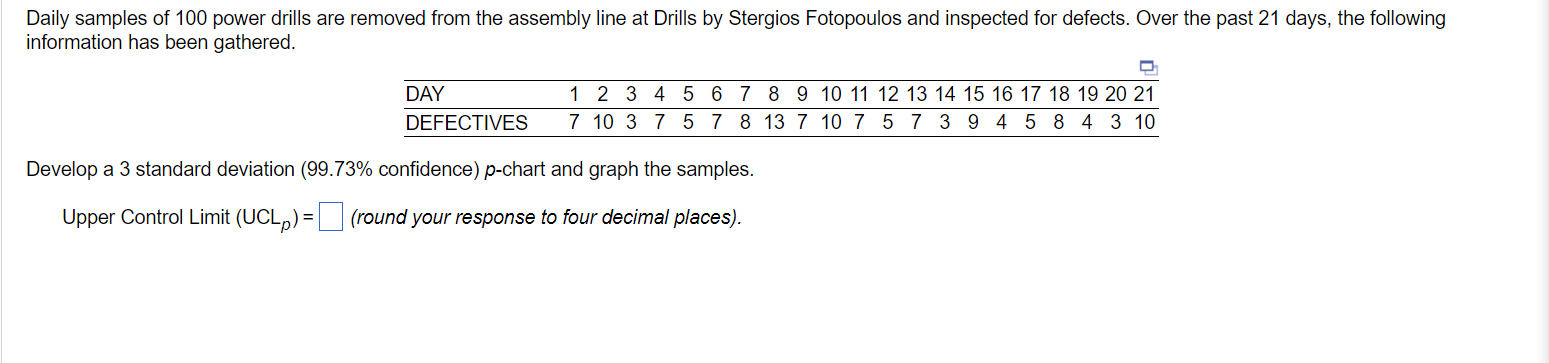
Develop a 3 standard deviation ( 99.73% confidence) p-chart and graph the samples. Upper Control Limit (UCLp)= (round your response to four decimal places)
Step by Step Solution
There are 3 Steps involved in it
1 Expert Approved Answer
Step: 1 Unlock

Question Has Been Solved by an Expert!
Get step-by-step solutions from verified subject matter experts
Step: 2 Unlock
Step: 3 Unlock