

Question: 1. Use data to develop a relationship statement between the voltage and current for each set of data. Explain the statement. 2. Use at least
1. Use data to develop a relationship statement between the voltage and current for each set of data. Explain the statement.
2. Use at least two sets of data to develop a relationship statement between resistance and current. (Compare using the same voltage settings) Explain the statement.
3. Should the current be constant as the voltage increases for each resistor set? Explain why or why not.
4. What is the current constant as the voltage increases for each resistor set? Use data to justify the answer. Please use the data in the image to answer these four questions
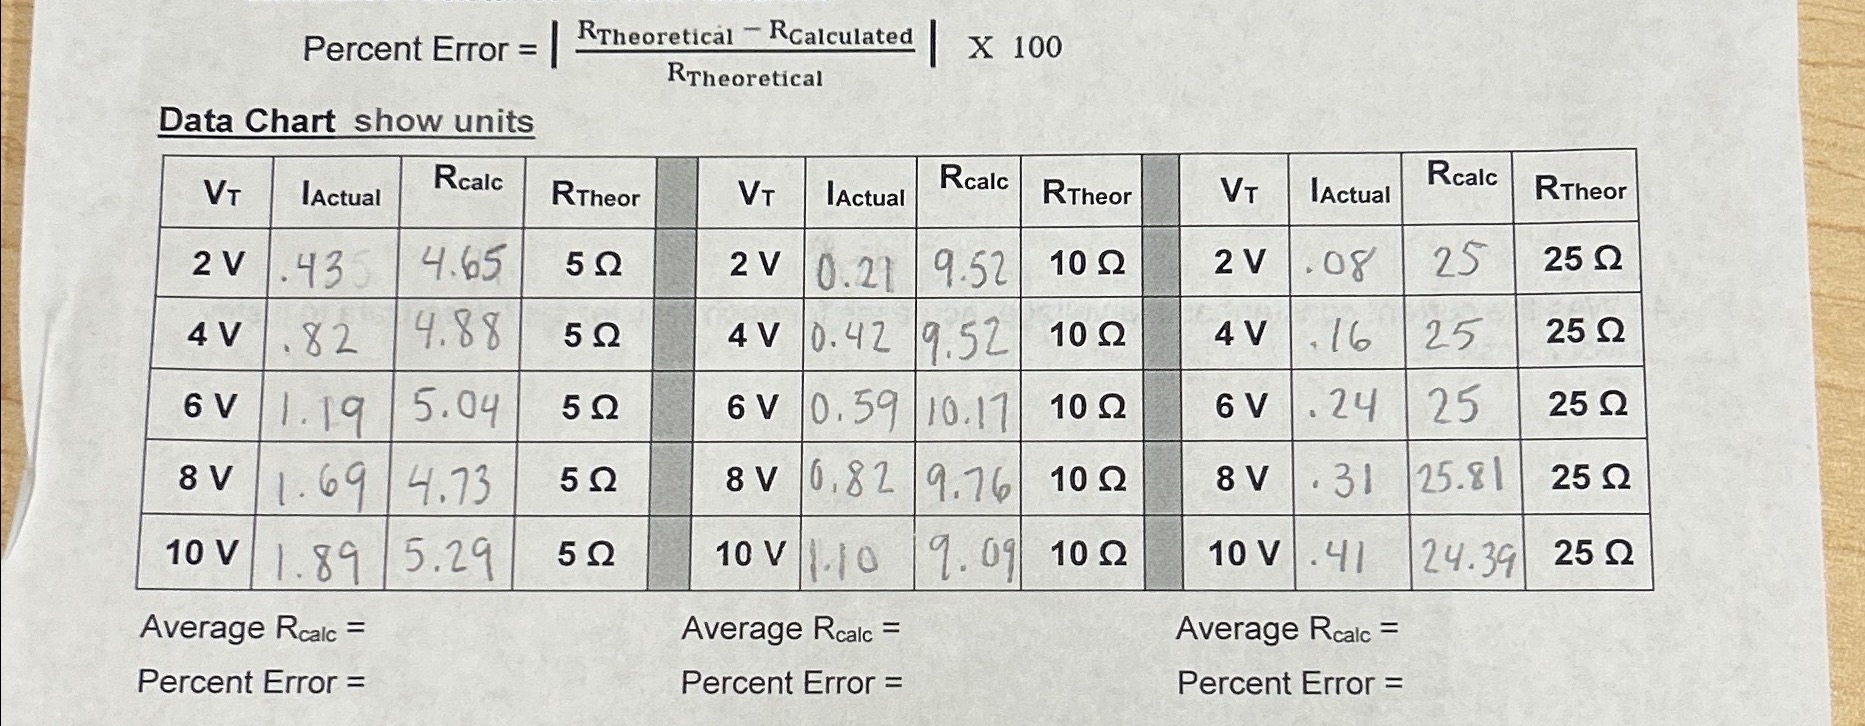
Percent Error = RTheoretical - Rcalculated X 100 RTheoretical Data Chart show units VT IActual Rcalc Rcalc RTheor VT IActual Rcalc RTheor VT IActual RTheor 2 V 435 4.65 2 V 0.21 9.52 10 Q 2 V . 08 25 25 Q 4 V 82 4.88 4 V 10. 42 9.52 10 Q 4 V 16 25 25 Q 6 V 1. 19 5.04 5Q 6 V 0. 59 10.17 10 Q 6 V . 24 25 25 Q 8 V 1. 69 4.73 8 V 10. 82 9.76 10 0 8 V . 31 25.81 25 Q 10 V 1. 89 5.29 50 10 V .10 9. 09 10 0 10 V . 41 24.39 25 Q Average Rcalc = Average Rcalc = Average Rcalc = Percent Error = Percent Error = Percent Error =
Step by Step Solution
There are 3 Steps involved in it

Get step-by-step solutions from verified subject matter experts