

Question: For the data given in the following table, identify a suitable decline model, determine model parameters, and project production rate till the end of
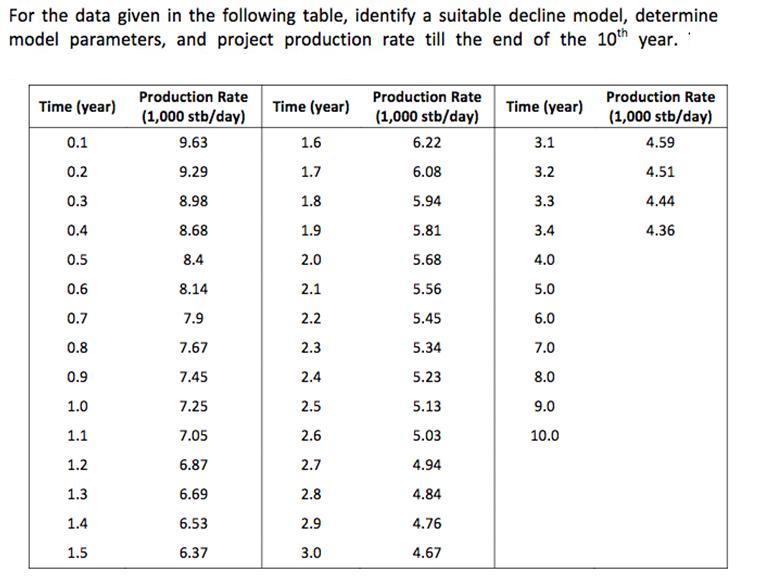
For the data given in the following table, identify a suitable decline model, determine model parameters, and project production rate till the end of the 10th year. Time (year) 0.1 0.2 0.3 0.4 0.5 0.6 0.7 0.8 0.9 1.0 1.1 1.2 1.3 1.4 1.5 Production Rate (1,000 stb/day) 9.63 9.29 8.98 8.68 8.4 8.14 7.9 7.67 7.45 7.25 7.05 6.87 6.69 6.53 6.37 Time (year) 1.6 1.7 1.8 1.9 2.0 2.1 2.2 2.3 2.4 2.5 2.6 2.7 2.8 2.9 3.0 Production Rate (1,000 stb/day) 6.22 6.08 5.94 5.81 5.68 5.56 5.45 5.34 5.23 5.13 5.03 4.94 4.84 4.76 4.67 Time (year) 3.1 3.2 3.3 3.4 4.0 5.0 6.0 7.0 8.0 9.0 10.0 Production Rate (1,000 stb/day) 4.59 4.51 4.44 4.36
Step by Step Solution
3.52 Rating (159 Votes )
There are 3 Steps involved in it

Get step-by-step solutions from verified subject matter experts