

Question: + 1. Use GeoGebra Calculator Suite data below. to create a scatterplot from the x 0 2 3 5 6 8 9 10 y
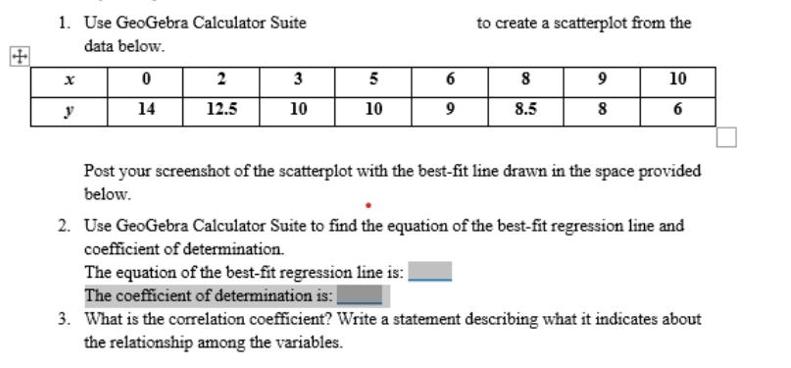
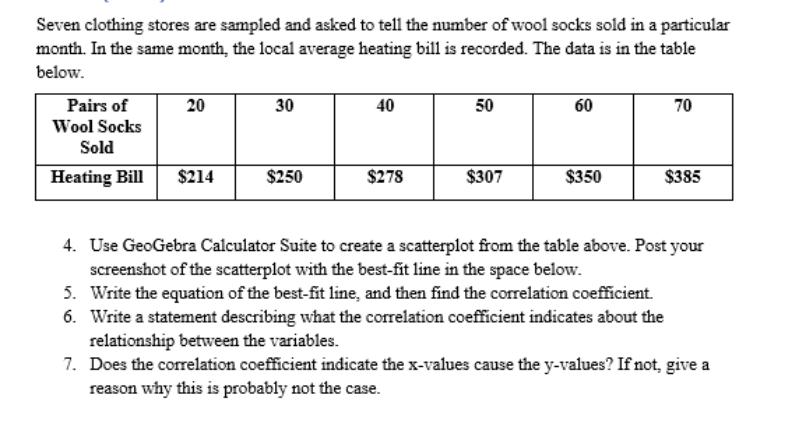
+ 1. Use GeoGebra Calculator Suite data below. to create a scatterplot from the x 0 2 3 5 6 8 9 10 y 14 12.5 10 10 9 8.5 8 6 Post your screenshot of the scatterplot with the best-fit line drawn in the space provided below. 2. Use GeoGebra Calculator Suite to find the equation of the best-fit regression line and coefficient of determination. The equation of the best-fit regression line is: | The coefficient of determination is: 3. What is the correlation coefficient? Write a statement describing what it indicates about the relationship among the variables. Seven clothing stores are sampled and asked to tell the number of wool socks sold in a particular month. In the same month, the local average heating bill is recorded. The data is in the table below. Pairs of Wool Socks Sold Heating Bill 20 30 40 50 60 70 $214 $250 $278 $307 $350 $385 4. Use GeoGebra Calculator Suite to create a scatterplot from the table above. Post your screenshot of the scatterplot with the best-fit line in the space below. 5. Write the equation of the best-fit line, and then find the correlation coefficient. 6. Write a statement describing what the correlation coefficient indicates about the relationship between the variables. 7. Does the correlation coefficient indicate the x-values cause the y-values? If not, give a reason why this is probably not the case.
Step by Step Solution
There are 3 Steps involved in it

Get step-by-step solutions from verified subject matter experts