

Question: 1. Use MATLAB to graph the following equations on one figure over the following range of x: -1 x 1. Put all plot commands in
1. Use MATLAB to graph the following equations on one figure over the following range of x: -1 x 1. Put all plot commands in the m-file.
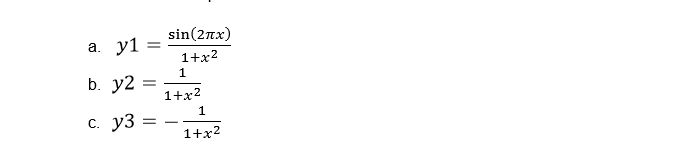
Please use the following formatting instructions.
Draw the graph of y1 using a solid blue line, draw the graph of y2 using a dashed red line, and draw the graph of y3 using a dashed green line.
Create a legend to indicate which curve is which.
Be sure to label your axes and a title.
Use enough points (i.e. adjust your range of x values) so your graphs look like smooth curves.
sin 2Tt.x 1+x2 1+x2 1+x2
Step by Step Solution
There are 3 Steps involved in it
1 Expert Approved Answer
Step: 1 Unlock

Question Has Been Solved by an Expert!
Get step-by-step solutions from verified subject matter experts
Step: 2 Unlock
Step: 3 Unlock