

Question: 1. Use the data table below for banks in the two asset size groups (a) $100 million-$1 billion and (b) more than $10 billion to
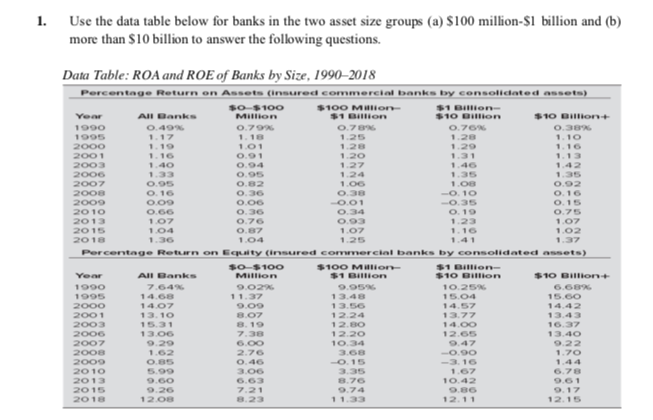
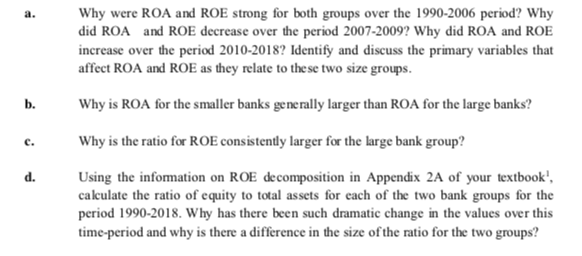
1. Use the data table below for banks in the two asset size groups (a) $100 million-$1 billion and (b) more than $10 billion to answer the following questions. Data Table: ROA and ROE of Banks by Size, 19902018 Percentage Return on Assets (Insured commercial banks by consolidated assets) SO-$100 $100 Mulion $1 Billion Year All Banks Million $1 Billion $10 Billion $10 Billion+ 1990 0.49% 0.79% 0.789 0.76 0.38% 1995 1.17 1.18 1.10 2000 1.19 1.01 1.28 1.29 1.16 2001 1.16 0.91 1.20 1.31 1.13 2003 1.40 0.94 1.27 2000 1.33 0.95 2007 0.95 0.82 1.00 1.08 0.92 2008 0.16 0.36 0.38 -0.10 0.16 2009 0.00 0.06 0.01 0.15 2010 0.66 0.36 0.34 0.19 0.75 2013 1.07 0.76 0.93 123 1.07 2015 1.04 0.87 1.07 1.16 1.02 2018 1.04 1.25 1.37 Percentage Return on Equity insured commercial banks by consolidated assets) $0-$100 $100 Million Year $1 Billion All Banks Million $1 Billion $10 Billion $10 Billion 1990 7.64% 9.0246 10.25% 6.68 1995 14.68 11.37 1 3.48 15.04 15.00 2000 14.07 9.09 13.56 14.57 14.42 2001 13.10 1 2.24 13.77 13.43 2003 15.31 8.19 12.30 14.00 16.37 2006 13.06 7.38 12.20 12.65 13.40 2007 9.20 6.00 10.34 9.22 2008 1.62 2.76 3.68 -0.90 1.70 2009 0.85 0.46 -0.15 -3.16 2010 3.06 1.67 6.78 2013 9.00 8.70 10.42 9.61 2015 9.26 7.21 9.74 9.86 0.17 2018 12.08 8.23 11.33 12.11 12.15 a. Why were ROA and ROE strong for both groups over the 1990-2006 period? Why did ROA and ROE decrease over the period 2007-2009? Why did ROA and ROE increase over the period 2010-2018? Identify and discuss the primary variables that affect ROA and ROE as they relate to these two size groups. b. c. d. Why is ROA for the smaller banks generally larger than ROA for the large banks? Why is the ratio for ROE consistently larger for the large bank group? Using the information on ROE decomposition in Appendix 2A of your textbook', calculate the ratio of equity to total assets for each of the two bank groups for the period 1990-2018. Why has there been such dramatic change in the values over this time-period and why is there a difference in the size of the ratio for the two groups? 1. Use the data table below for banks in the two asset size groups (a) $100 million-$1 billion and (b) more than $10 billion to answer the following questions. Data Table: ROA and ROE of Banks by Size, 19902018 Percentage Return on Assets (Insured commercial banks by consolidated assets) SO-$100 $100 Mulion $1 Billion Year All Banks Million $1 Billion $10 Billion $10 Billion+ 1990 0.49% 0.79% 0.789 0.76 0.38% 1995 1.17 1.18 1.10 2000 1.19 1.01 1.28 1.29 1.16 2001 1.16 0.91 1.20 1.31 1.13 2003 1.40 0.94 1.27 2000 1.33 0.95 2007 0.95 0.82 1.00 1.08 0.92 2008 0.16 0.36 0.38 -0.10 0.16 2009 0.00 0.06 0.01 0.15 2010 0.66 0.36 0.34 0.19 0.75 2013 1.07 0.76 0.93 123 1.07 2015 1.04 0.87 1.07 1.16 1.02 2018 1.04 1.25 1.37 Percentage Return on Equity insured commercial banks by consolidated assets) $0-$100 $100 Million Year $1 Billion All Banks Million $1 Billion $10 Billion $10 Billion 1990 7.64% 9.0246 10.25% 6.68 1995 14.68 11.37 1 3.48 15.04 15.00 2000 14.07 9.09 13.56 14.57 14.42 2001 13.10 1 2.24 13.77 13.43 2003 15.31 8.19 12.30 14.00 16.37 2006 13.06 7.38 12.20 12.65 13.40 2007 9.20 6.00 10.34 9.22 2008 1.62 2.76 3.68 -0.90 1.70 2009 0.85 0.46 -0.15 -3.16 2010 3.06 1.67 6.78 2013 9.00 8.70 10.42 9.61 2015 9.26 7.21 9.74 9.86 0.17 2018 12.08 8.23 11.33 12.11 12.15 a. Why were ROA and ROE strong for both groups over the 1990-2006 period? Why did ROA and ROE decrease over the period 2007-2009? Why did ROA and ROE increase over the period 2010-2018? Identify and discuss the primary variables that affect ROA and ROE as they relate to these two size groups. b. c. d. Why is ROA for the smaller banks generally larger than ROA for the large banks? Why is the ratio for ROE consistently larger for the large bank group? Using the information on ROE decomposition in Appendix 2A of your textbook', calculate the ratio of equity to total assets for each of the two bank groups for the period 1990-2018. Why has there been such dramatic change in the values over this time-period and why is there a difference in the size of the ratio for the two groups
Step by Step Solution
There are 3 Steps involved in it

Get step-by-step solutions from verified subject matter experts