

Question: 1. Use the following data to work Problems a to g. Ethanol (barrels per day) 70 64 54 40 22 0 Food crops (tons
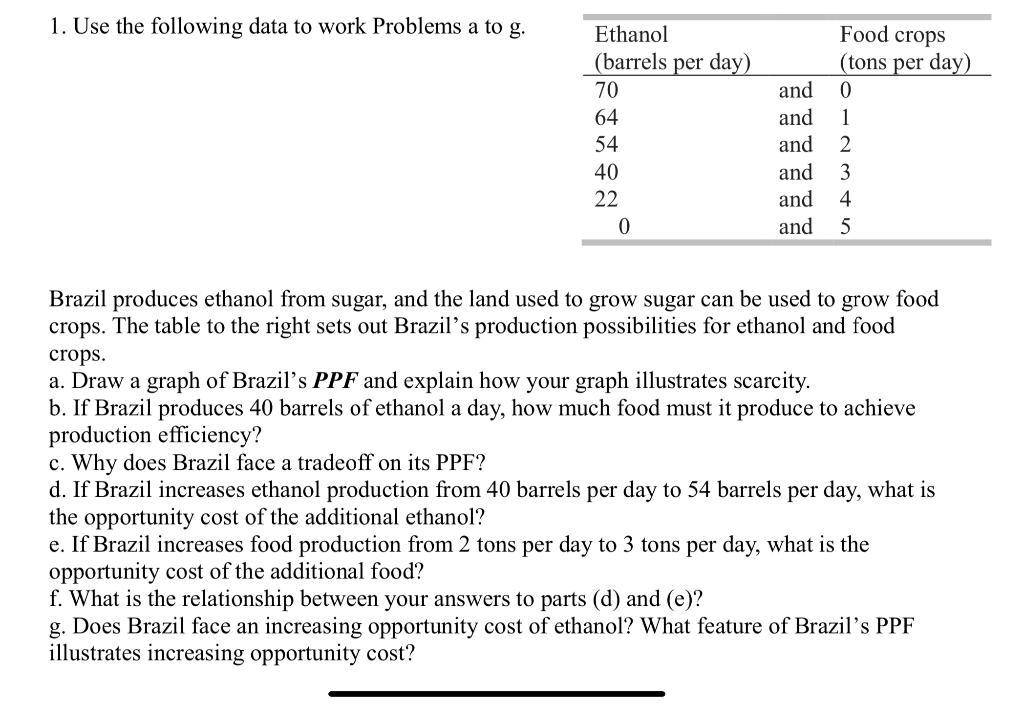
1. Use the following data to work Problems a to g. Ethanol (barrels per day) 70 64 54 40 22 0 Food crops (tons per day) and 0 and 1 and 2 and 3 and 4 and 5 Brazil produces ethanol from sugar, and the land used to grow sugar can be used to grow food crops. The table to the right sets out Brazil's production possibilities for ethanol and food crops. a. Draw a graph of Brazil's PPF and explain how your graph illustrates scarcity. b. If Brazil produces 40 barrels of ethanol a day, how much food must it produce to achieve production efficiency? c. Why does Brazil face a tradeoff on its PPF? d. If Brazil increases ethanol production from 40 barrels per day to 54 barrels per day, what is the opportunity cost of the additional ethanol? e. If Brazil increases food production from 2 tons per day to 3 tons per day, what is the opportunity cost of the additional food? f. What is the relationship between your answers to parts (d) and (e)? g. Does Brazil face an increasing opportunity cost of ethanol? What feature of Brazil's PPF illustrates increasing opportunity cost?
Step by Step Solution
3.47 Rating (160 Votes )
There are 3 Steps involved in it
A PPF Let Food is on ... View full answer

Get step-by-step solutions from verified subject matter experts