

Question: 1. Use the graphs that represent Aggregate -Aggregate Supply Model including the LABOR MARKET with labor demand curve and labor supply curve Diagram 1 (product
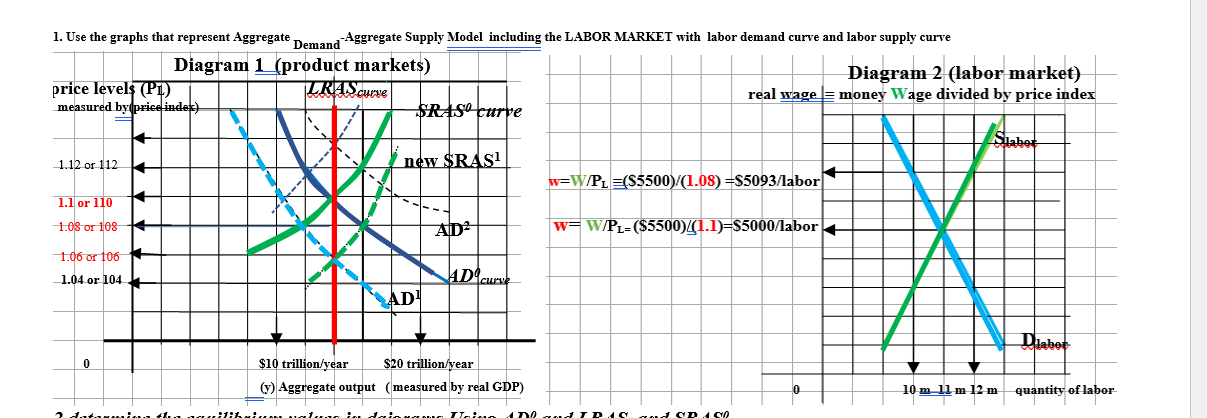
1. Use the graphs that represent Aggregate -Aggregate Supply Model including the LABOR MARKET with labor demand curve and labor supply curve Diagram 1 (product markets) Diagram 2 (labor market) price levels (PI) LRAScurve real wage = money Wage divided by price index measured by(price index) Sulabor 1.12 or 112 W=W/PL =($5500)/(1.08) =$5093/labor 1.1 or 110 1.08 or 108 W=W/PL= ($5500)/(1.1)=$5000/labor 1.06 or 106 1.04 or 104 ADI Dlabor $10 trillion/year $20 trillion/year (y) Aggregate output ( measured by real GDP) 10 m Il m 12 m quantity of laborh. Now assume AD shifts from AD' to AD', now determine the following assuming the other curves don't shift 1 new price level = 2. new aggregate output demanded = 3. new aggregate output supplied 4. name the macroeconomic problem that was caused by the decrease in AD curve
Step by Step Solution
There are 3 Steps involved in it

Get step-by-step solutions from verified subject matter experts