

Question: *1 Use the returns data below for two stocks, construct a mean-variance efficient frontier. (1) Calculate the covariances of two assets (2) For each of
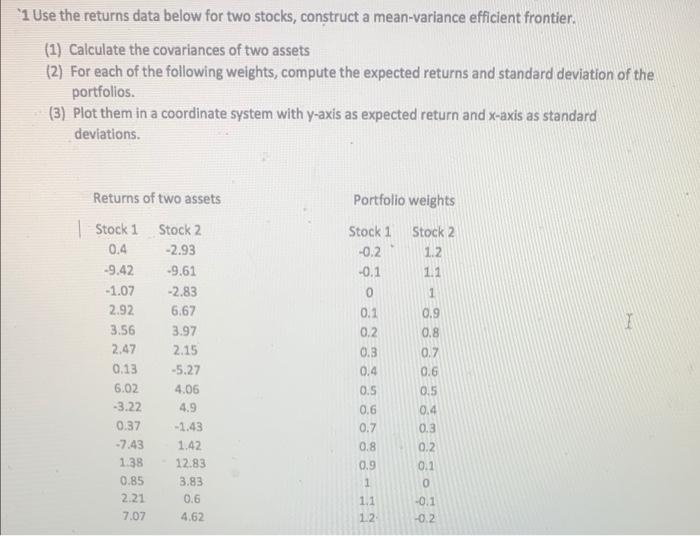
*1 Use the returns data below for two stocks, construct a mean-variance efficient frontier. (1) Calculate the covariances of two assets (2) For each of the following weights, compute the expected returns and standard deviation of the portfolios. (3) Plot them in a coordinate system with y-axis as expected return and x-axis as standard deviations. Portfolio weights Stock 1 -0.2 -0.1 0 Stock 2 1.2 1.1 1 0.9 I 0.8 Returns of two assets | Stock 1 Stock 2 0.4 -2.93 -9.42 -9.61 -1.07 -2.83 2.92 6.67 3.56 3.97 2.47 2.15 0.13 -5.27 6.02 4.06 -3.22 4.9 0.37 -1.43 -7.43 1.42 1.38 12.83 0.85 3.83 2.21 0.6 7.07 4.62 0.1 0.2 0.3 0.4 0.5 0.6 0.7 0.8 0.9 1 0.7 0.6 0.5 0.4 0.3 0.2 0.1 0 -0.1 -0.2 1.1 12
Step by Step Solution
There are 3 Steps involved in it

Get step-by-step solutions from verified subject matter experts